Fiorano Webconsole provides a web-based monitoring tool for the Fiorano ESB Network and hence is commonly called the Dashboard. Apart from the monitoring feature, it also provides support for launching, stopping, and restarting an application using a web interface. The below section gives comprehensive insight on how to log on to the Dashboard and about the features available in each section of the Dashboard.
Login Page
Fiorano ESB Webconsole can be accessed by starting the Fiorano Enterprise Server (FES) and then opening http://localhost:1980/FioranoESB on a web browser. Alternatively, access it using the Fiorano Web Console link present on the Start Menu.
Log in by entering the credentials configured for the FES; default credentials are:
- Username: admin
- Password: passwd
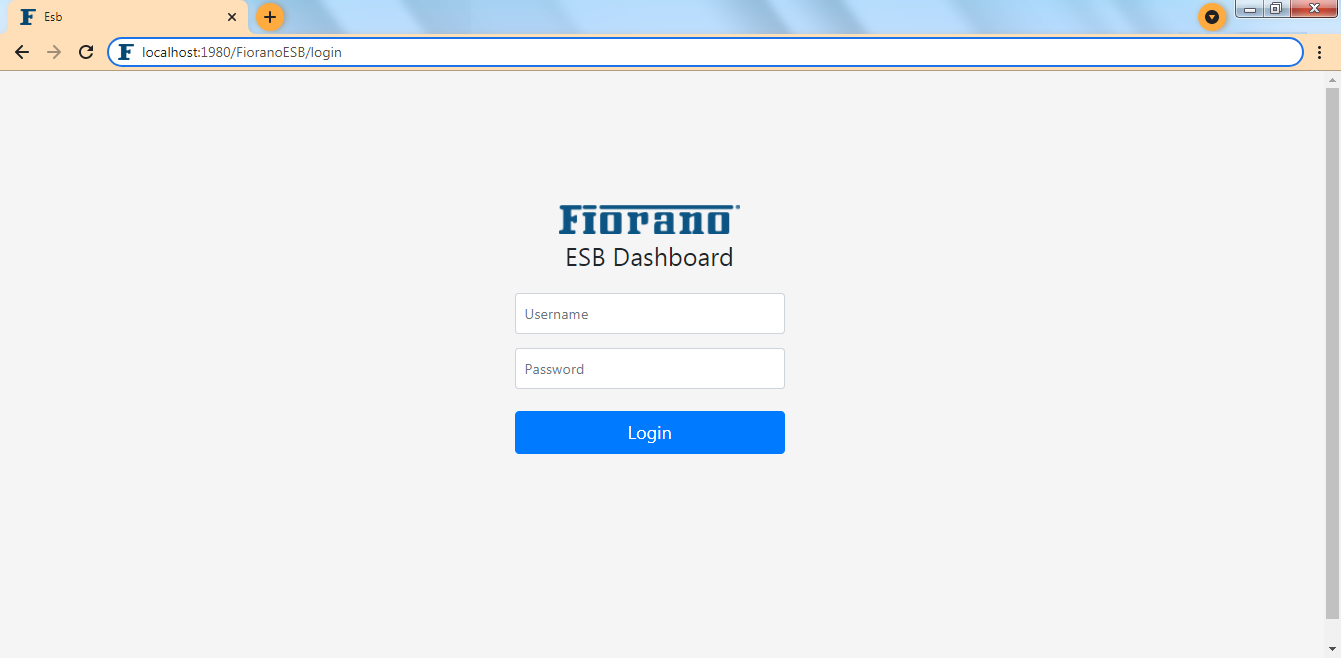
Figure 1: Fiorano Web Console Login Page
Each tab under the left navigation panel in the Fiorano Web Console (see the figure below), which is listed below, helps to accomplish various tasks.
Icon Reference


Servers
The Servers tab shows the details of the available Fiorano Enterprise Servers, Peer Servers, and Server Groups.
Enterprise Servers
The top view of the Enterprise Servers page shows the server name, server profile, status, memory usage, and CPU Utilization.
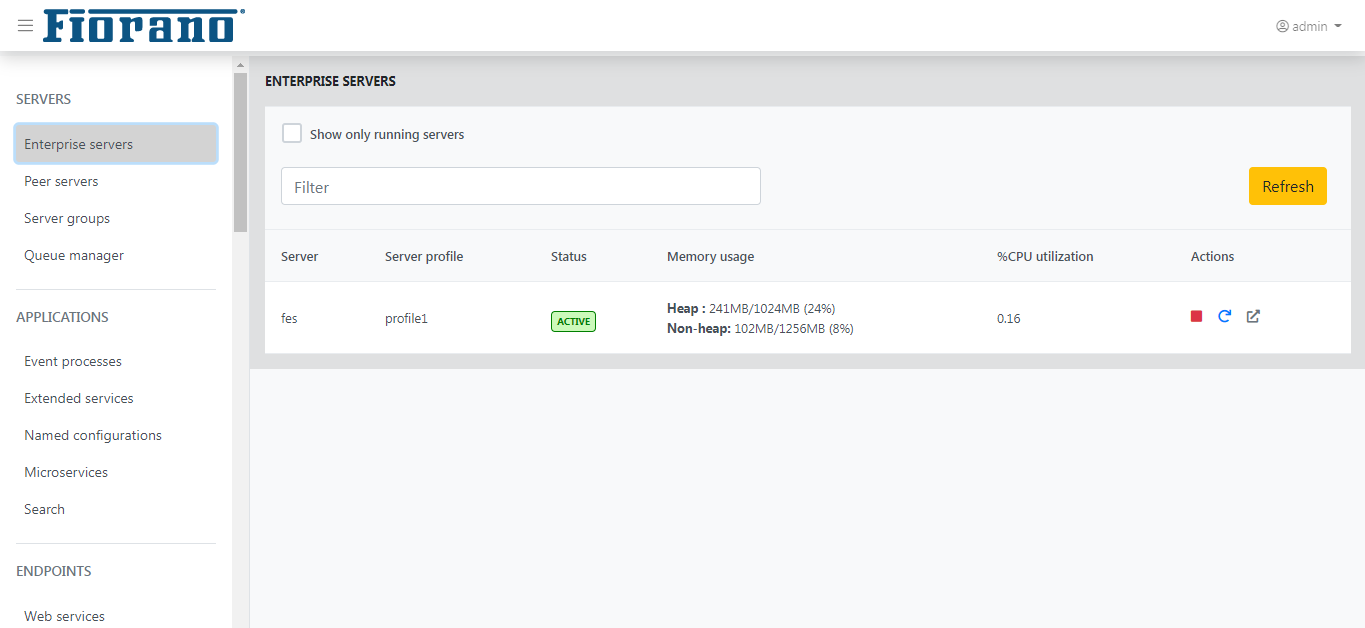
Figure 2: Enterprise Servers page showing FES details
Configuration
Displays the basic details of the server and its configuration divided into two separate sections; click the respective headings to list the details.
Basic Details
It lists the details as follows: B2B Jetty port, BPM Jetty port, Dashboard Jetty SSL port, Dashboard Jetty port, HA enabled, Internal connections port, Max memory, Name, RmiConnectorServer listening port, Server PID, Server URL, Thread count, and Used memory.
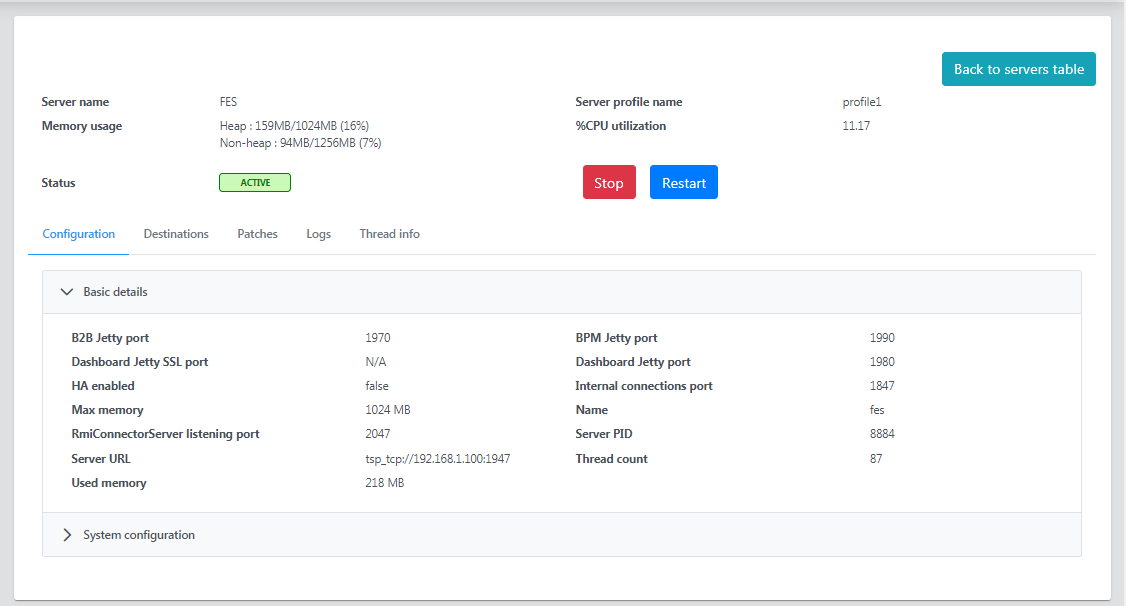
Figure 3: Basic details section under the Configuration tab
System Configuration
It lists the details as follows: Available CPU cores, IP, JRE, OS, RAM, Total disk space, Usable disk space, and Used disk space.
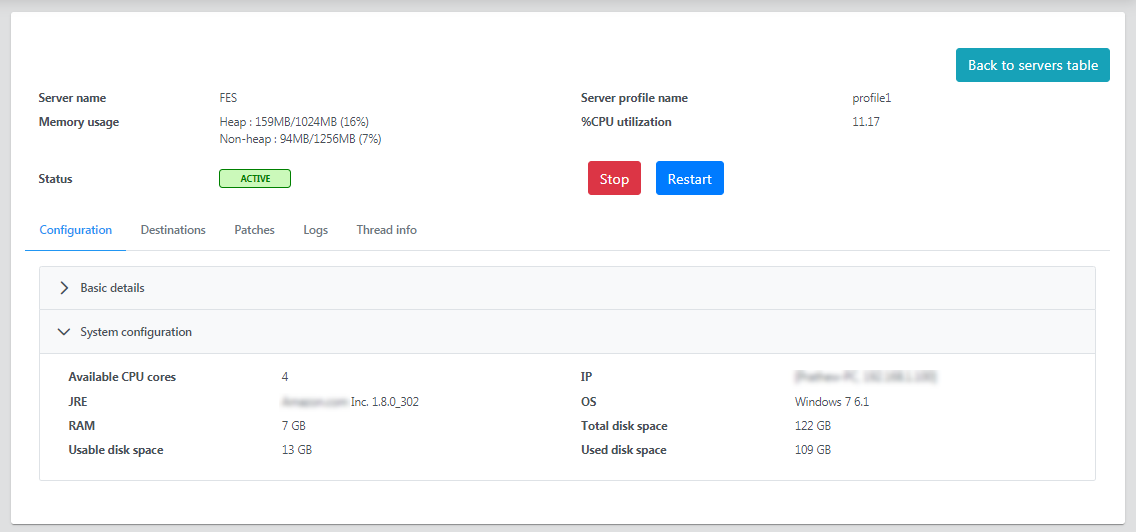
Figure 4: System configuration section under the Configuration tab
Destinations
Displays the details of Topics, Queues, and Connections divided into three separate sections; click the respective headings to list the details.
Topics
Displays the list of JMS topics present in the server with details such as Topic name, active subscribers, active publishers, and passive durable subscribers.
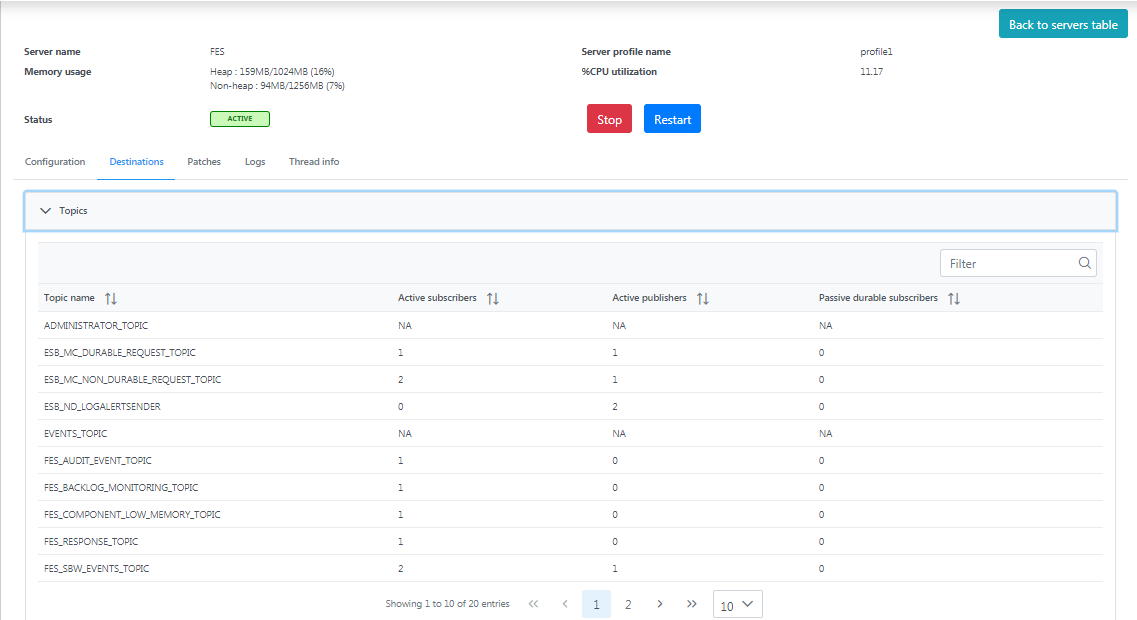
Figure 5: Topics section under the Destinations tab
Queues
Displays the list of queues present in the server with details such as Queue name, senders, receivers, pending messages, inbound messages, rate of inbound messages, outbound messages, and rate of outbound messages.
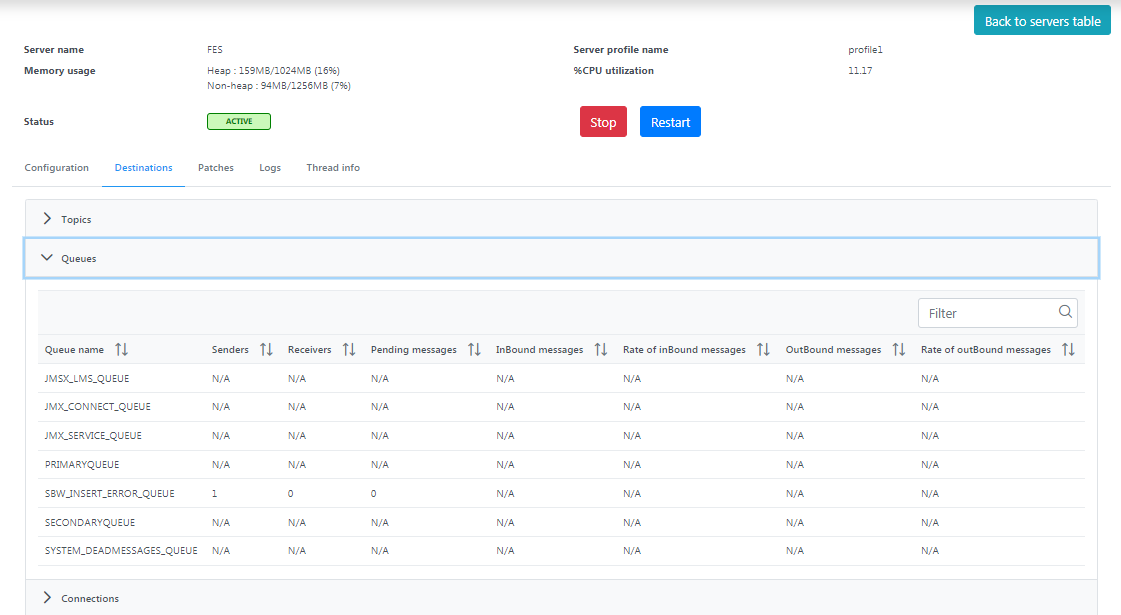
Figure 6: Queues section under the Destinations tab
Connections
Displays the list of connections created by the server, along with the connection name and connection type.
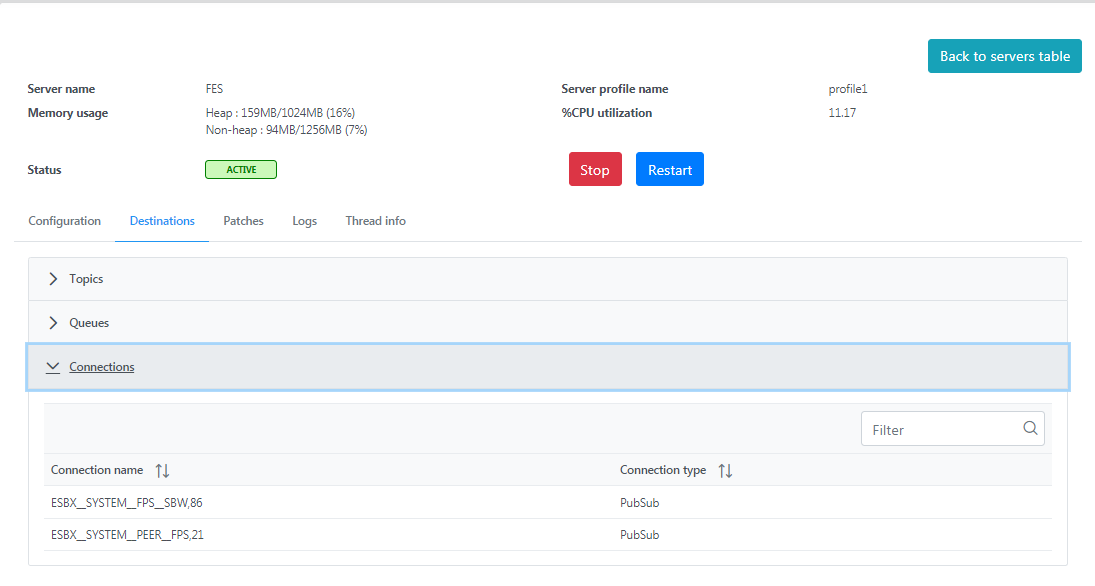
Figure 7: Connections section under the Destinations tab
Patches
Displays the details of the installed/uninstalled/failed patches to the server and microservices divided into two separate sections; click the respective headings to list the details.
Server
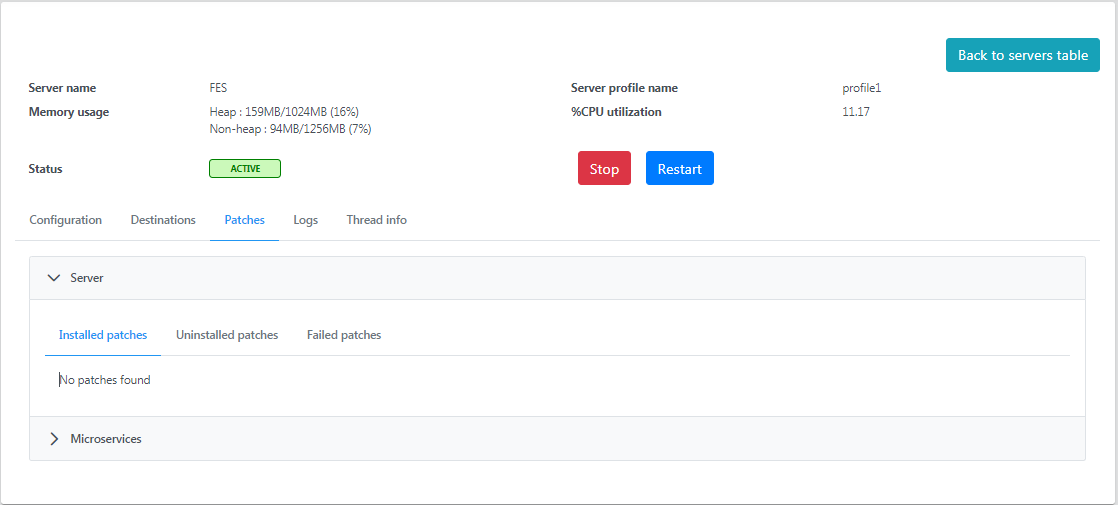
Figure 8: Server section under the Patches tab displaying details of installed/uninstalled/failed patches
Microservices
This section displays the patches installed for a microservice. After importing the patch from the eStudio Micro Service Repository, the microservice details reflect here.
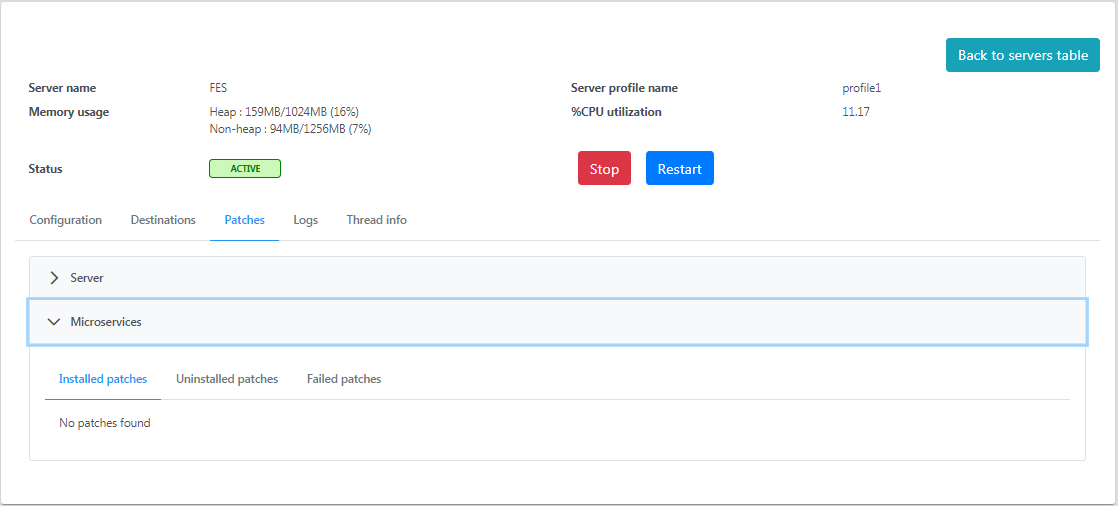
Figure 9: Microservices section under the Patches tab displaying details of installed/uninstalled/failed patches
Logs
Displays the details of log messages such as output logs, error logs, MQ output logs, and MQ error logs with the date, type and detail of each log; click the respective headings to list the details.
| Icon Reference / Additional options | |
|---|---|
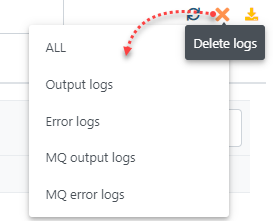
| Refresh logs to show the present logs | |
 | Helps to delete the logs. Click the icon to choose to delete output logs, error logs, MQ output logs, and MQ error logs or all of these.
|
 | Downloads all the logs as a Zip file to the default downloads folder of the system. |
 | Provide a number to define the number of rows of records to be displayed on the page. |
 | The Filter option helps to track a particular log by keyword. |
Output logs
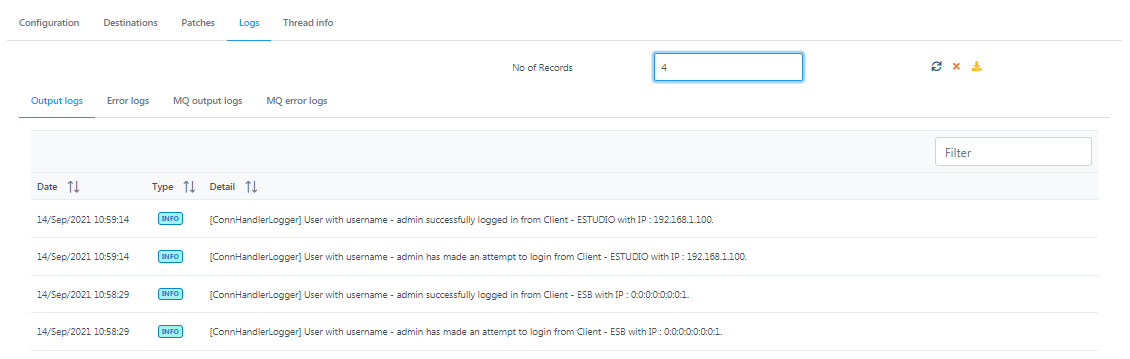
Figure 10: Output logs section under the Logs tab displaying date, type and details of logs
Error Logs
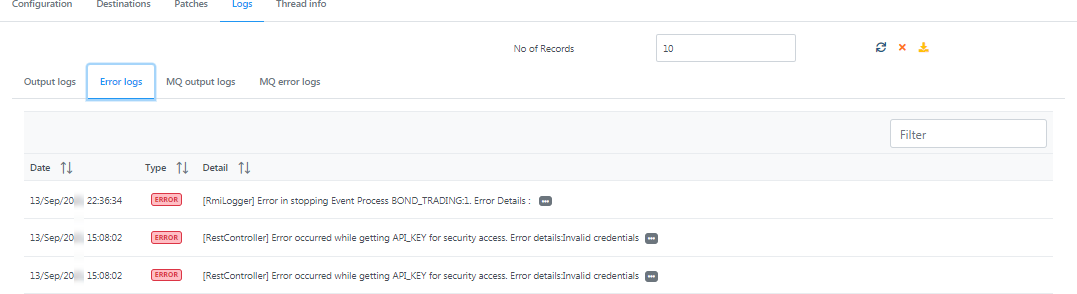
Figure 11: Error logs section under the Logs tab displaying date, type and details of logs
MQ Output logs
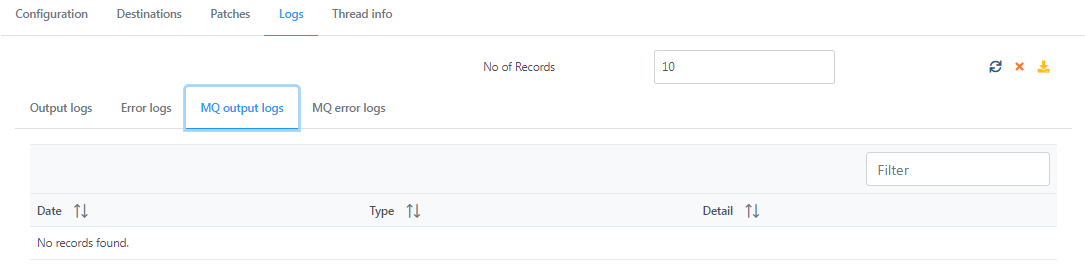
Figure 12: MQ output logs section under the Logs tab displaying date, type and details of logs
MQ error logs
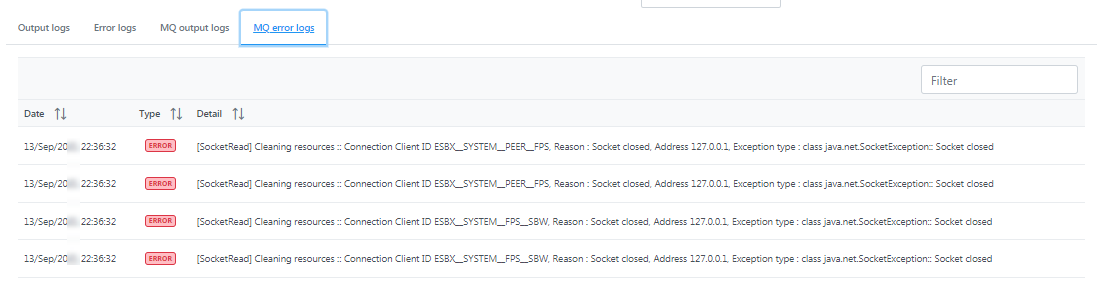
Figure 13: MQ error logs section under the Logs tab displaying date, type and details of logs
Thread info
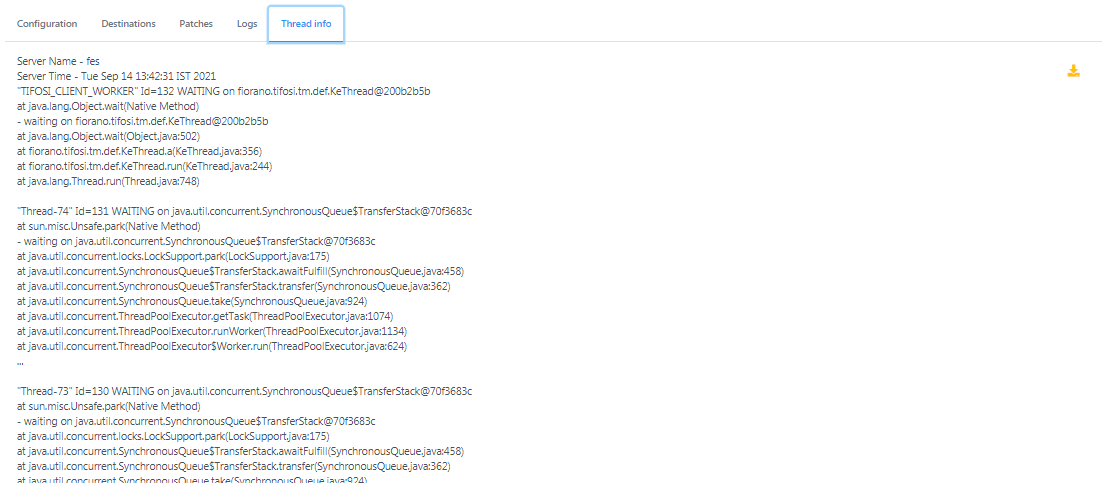
Figure 14: Thread info tab showing thread details of fes
Peer Servers
The top view of the Peer Servers page shows the server name, server profile, status, memory usage, and CPU Utilization.
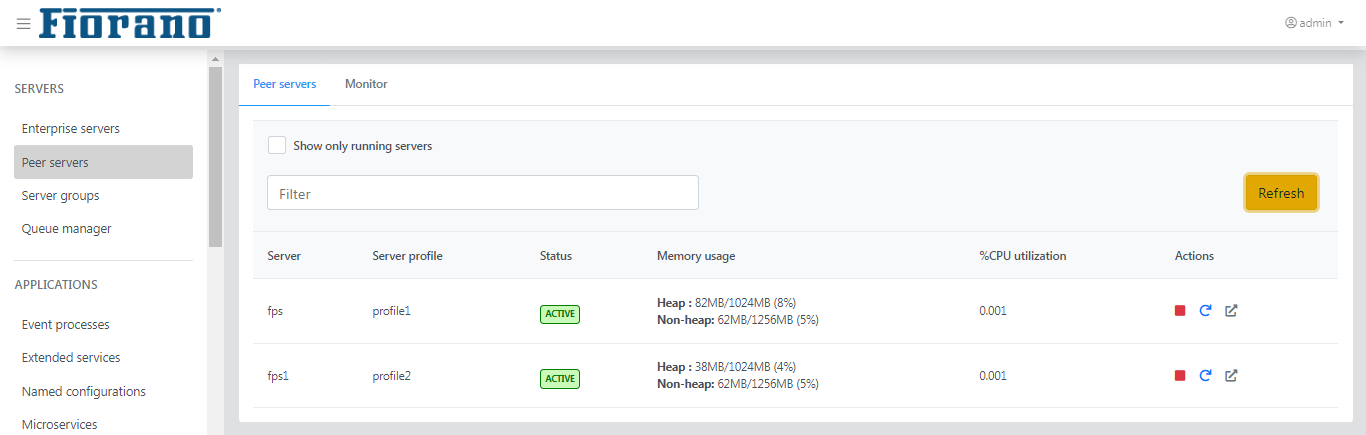
Figure 15: Peer server tab showing details of peer servers
Process
This section in the Details page shows the microservices running on the FPS as a result of the Event Processes that are running and the Extended Services working on the peer server; click the respective headings to list the details.
Running Components
Displays the list of microservices with details such as service instance name, service GUID, server version, application name, application version, launch type, memory usage, and process ID.
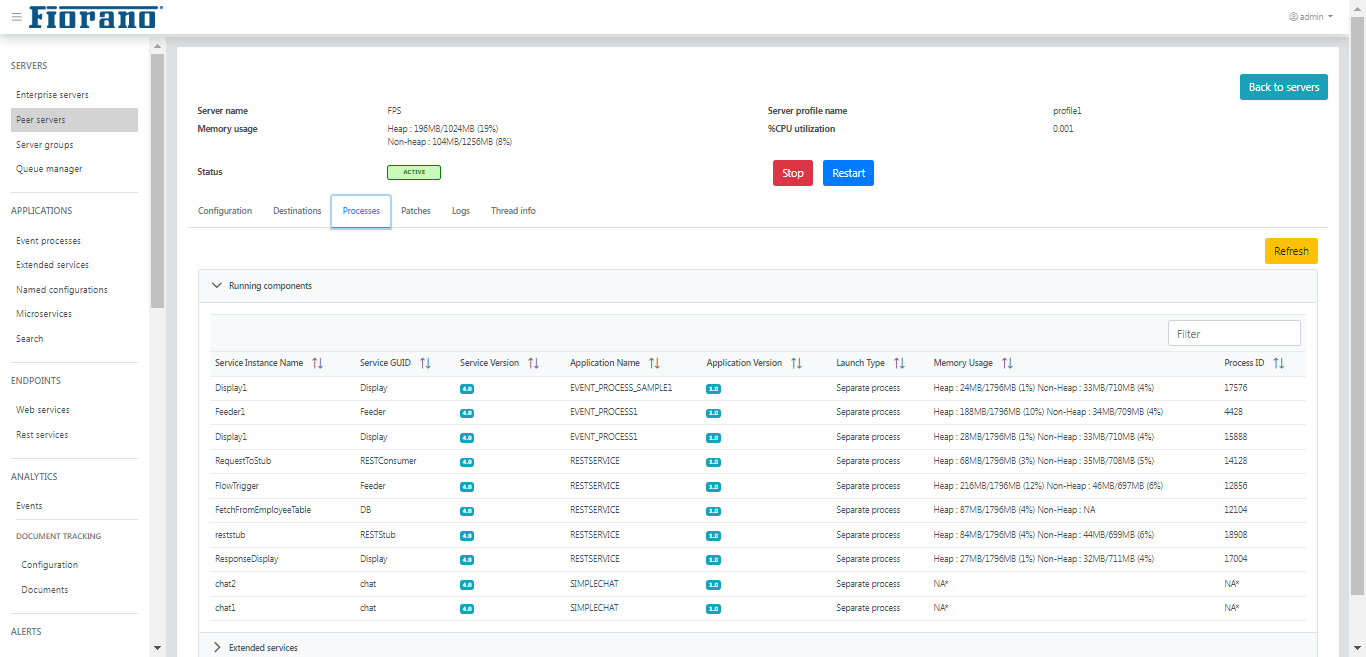
Figure 16: Running components section under the Processes tab displaying details of the microservices running on the peer server
Extended Services
Displays the list of Extended Services with details such as extended service GUID, version, status, start time, server group, route durable, and delete destination.
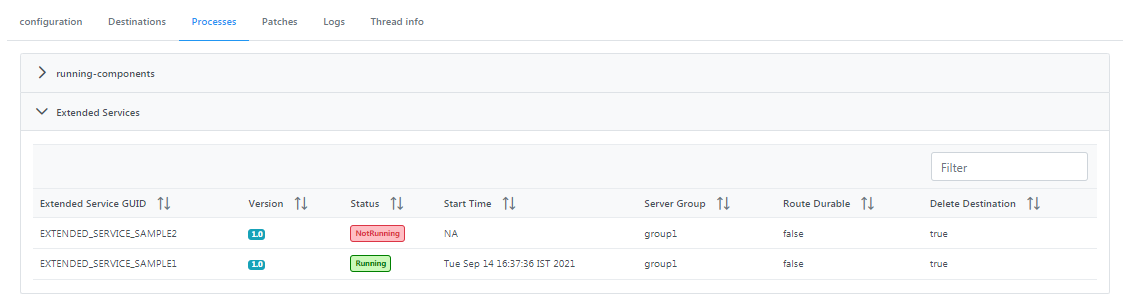
Figure 16: Extended Services section under the Processes tab displaying details of the extended service event processes running on the peer server
Monitor
Click the Monitor tab next to the Peer server tab for Server downtime/uptime monitoring. CPU utilization, downtime, and memory usage of a selected peer server will be graphically represented by various chart types such as line, bar, radar and horizontal bar. Various options present on the page are:
- Peer name: Select the server to be analyzed.
- No of Records: Provide the number of records to be displayed in the chart.
- Date duration: Choose whether the analysis has to be done for the day, for the last 3 days, for the week, or for the month. The Custom date option can be used to analyze for a particular time period.
- Data Aggregation: Options change depending on the Date duration (above) By minute or by hour for the Date duration "Today", by hour or by day for Last 3 days, by day for Last Week, by month, by week and by day for Last month. Date aggregation type for the Custom date Date duration will be based on the period being chosen.
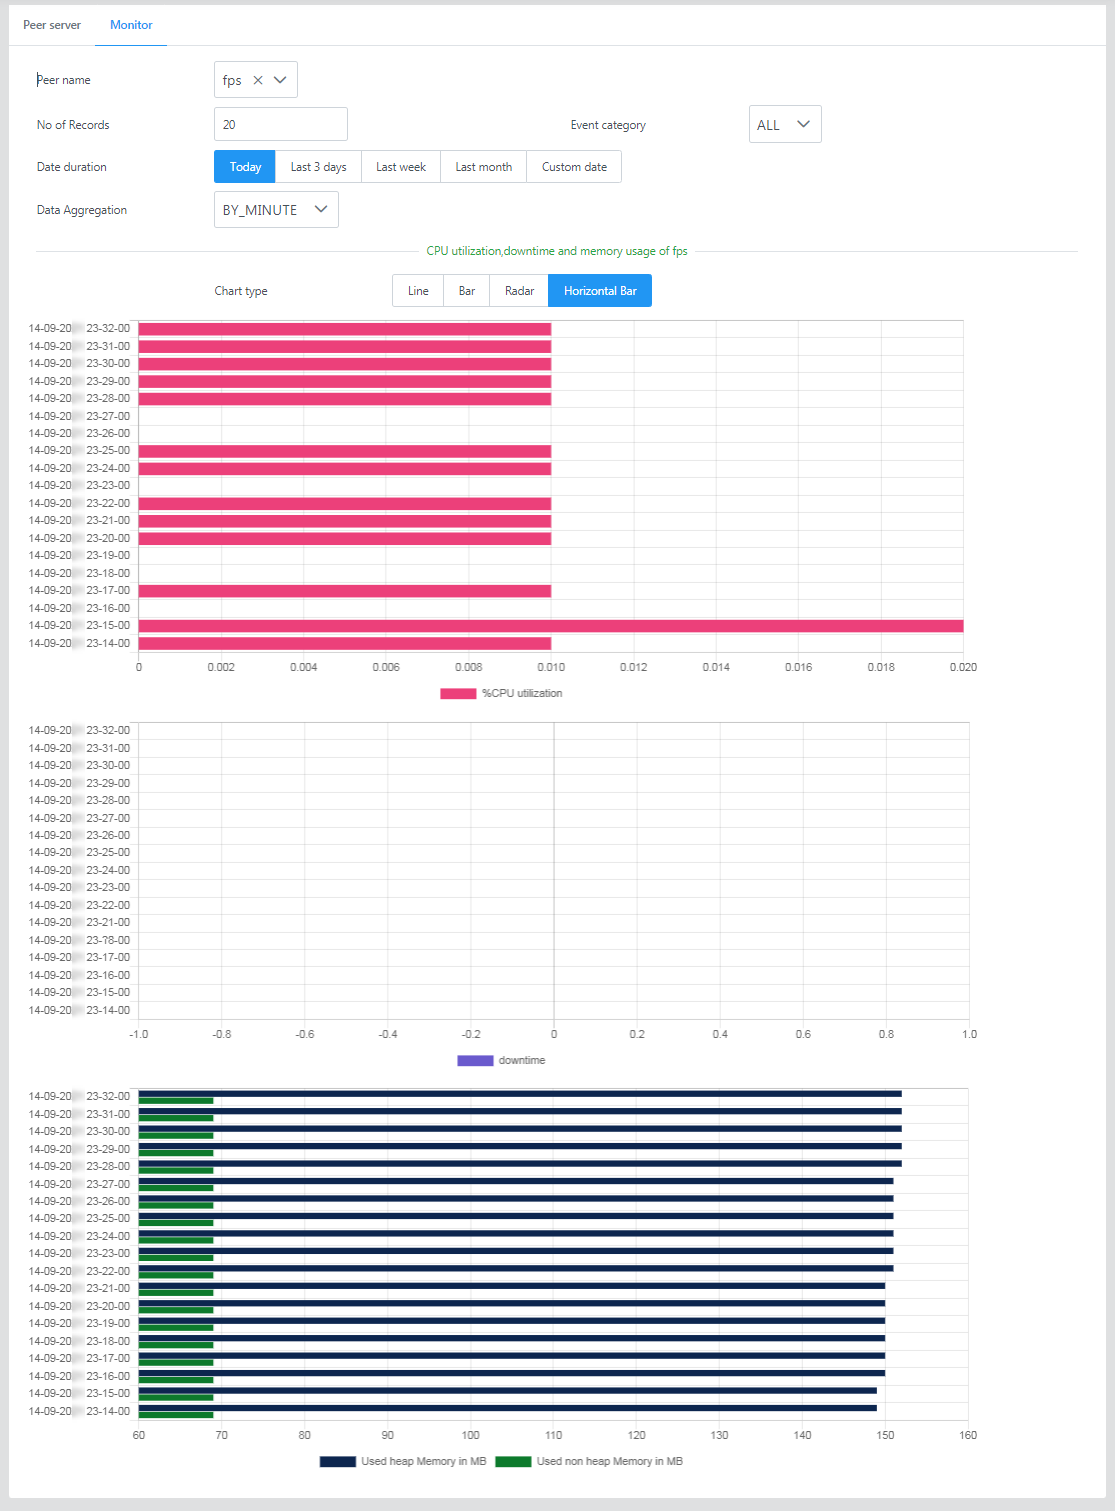
Figure 17: Monitor tab displaying a graphical representation of CPU utilization, downtime, and memory usage of a selected server
Server groups
A server group allows to keep multiple peer servers in a group which helps in load balancing.
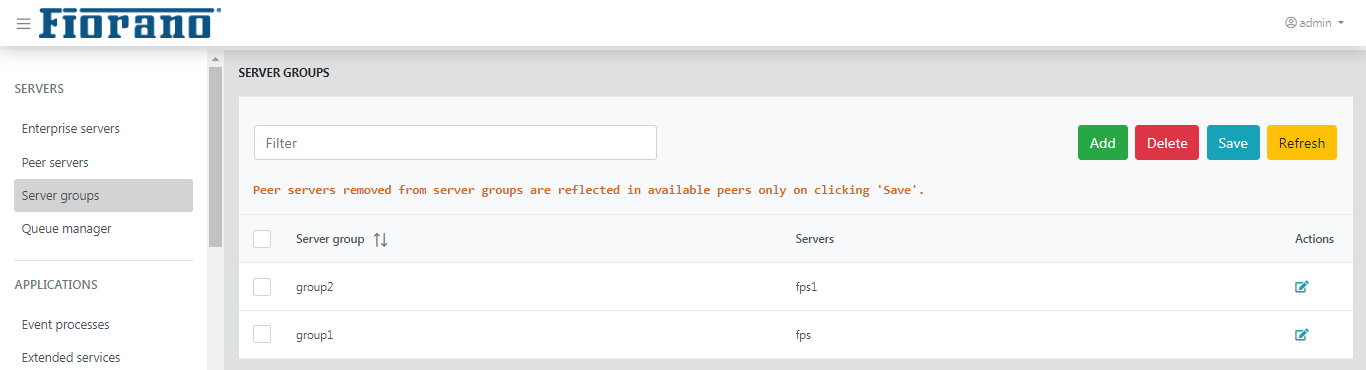
Figure 18: Server groups page with the details of default server groups
Adding a new server group
By default, the Server Group group1 will have the fps server and group2 will have fps1. To add a new Server Group, perform the following actions:
- Click the Add button, type the name of the new server group to be added and click the Add button that is on the right side of the name entered; the group gets added to the list.
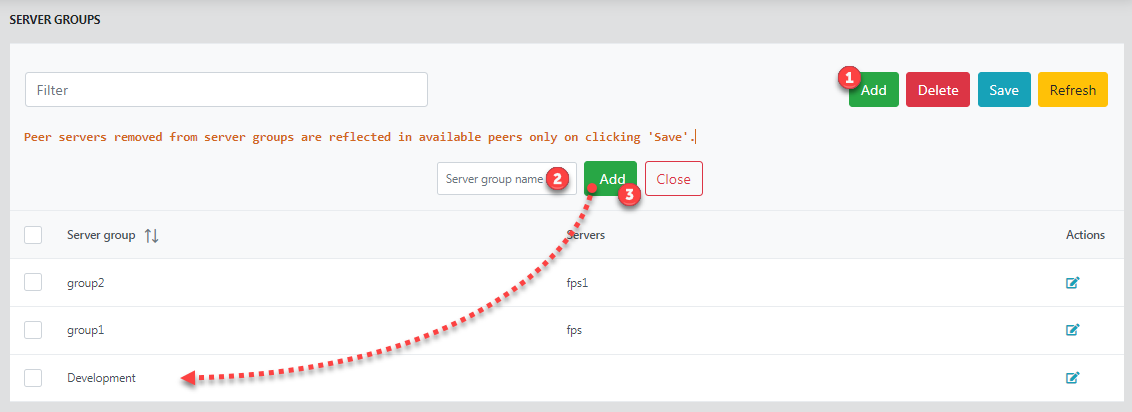
Figure 19: Adding a new server group In the newly added group, click the Edit button under the Action column to add servers.
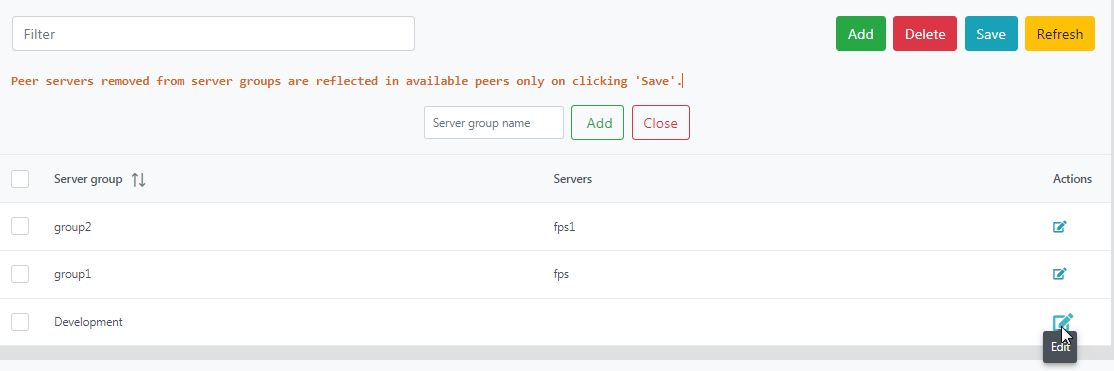
Figure 20: Edit servers option to add/remove serversSelect a server from the Available peers section and click the left arrow button to move the server to the Server in <Group Name> section.
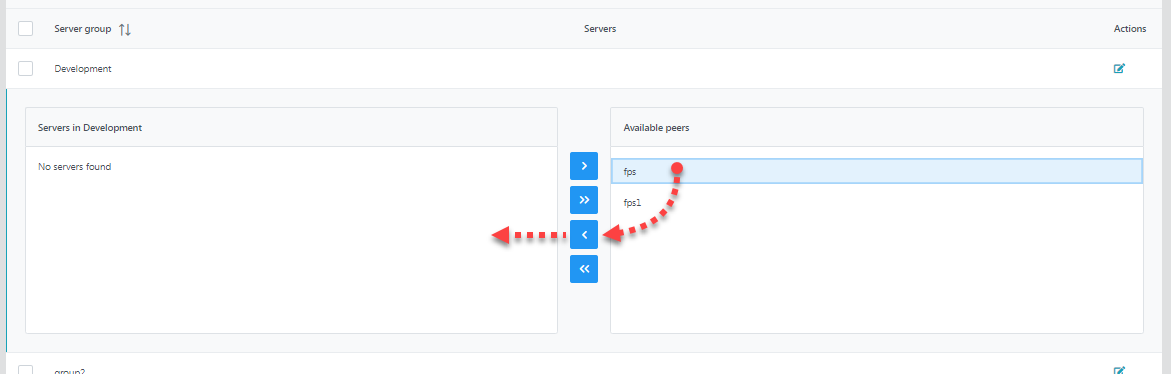
Figure 21: Adding servers to a new server groupMove as many servers as needed/available and click the Save button.
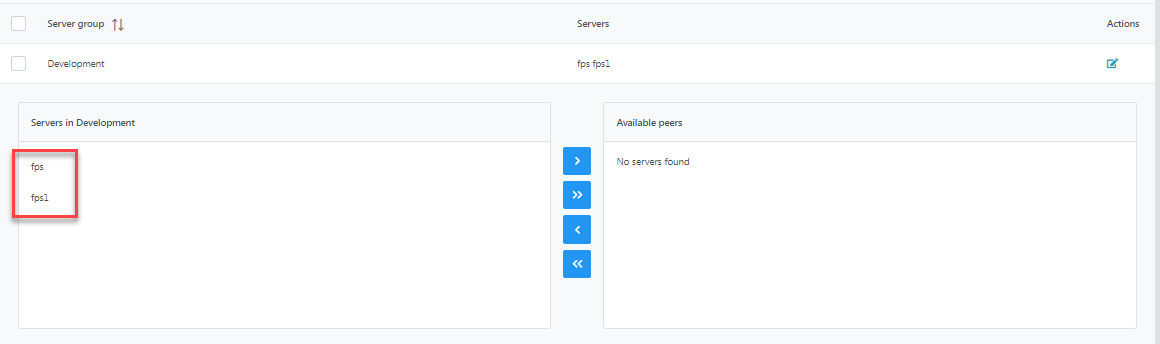
Figure 22: Servers added from the Available peers sectionClick the Refresh button to hide the editing windows. The new group with multiple servers will be displayed.
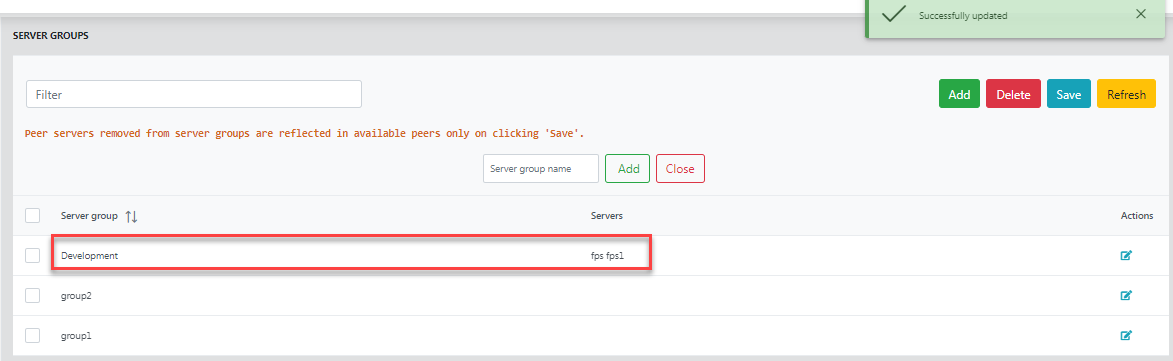
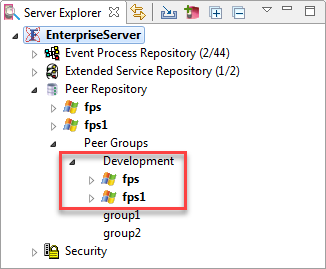
Figure 23: The new server group with the added servers
To delete a group, select the group and click the Delete button. If servers are attached to the group while it is being deleted, those servers will be free from the group after deleting and can be used by other groups.
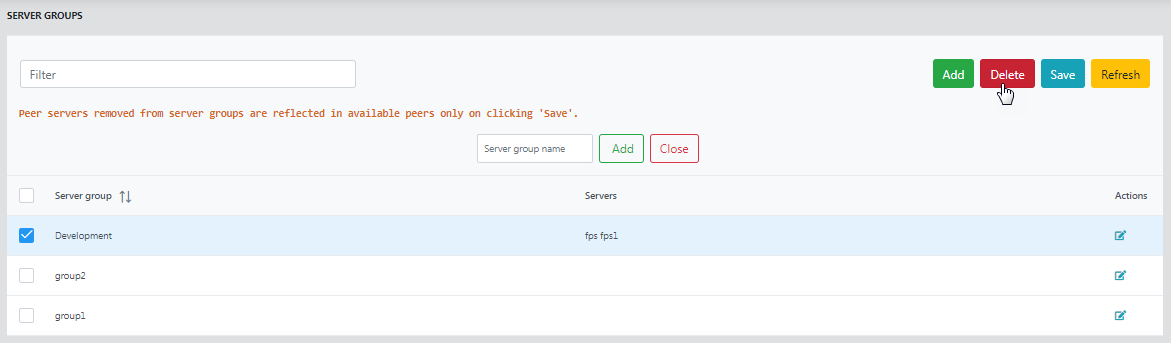
Figure 19: Deleting a server group
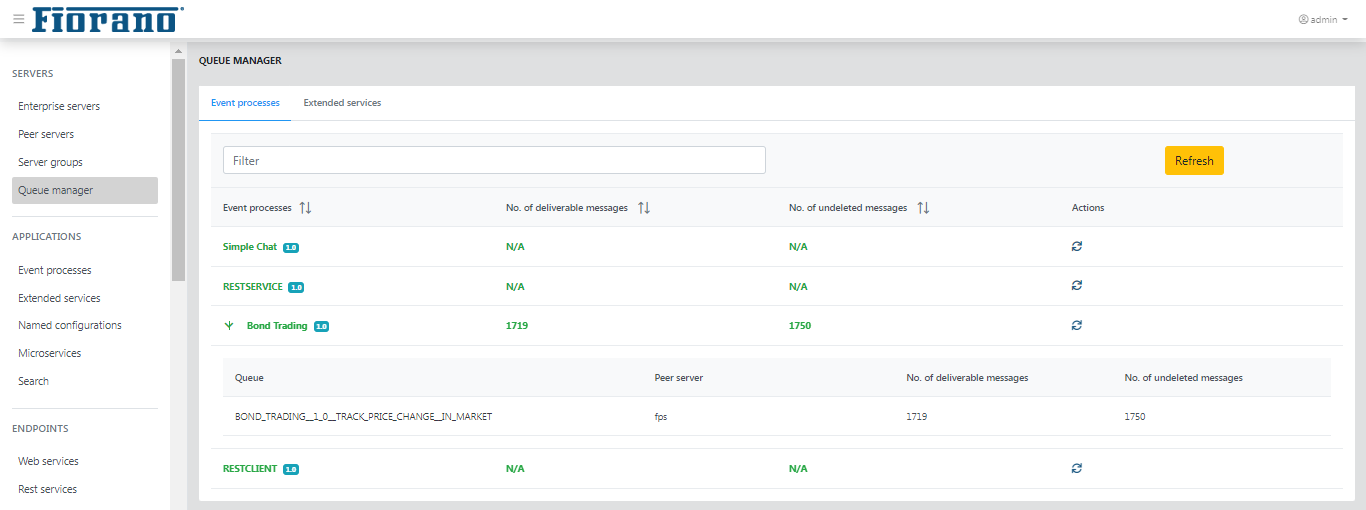
Queue Manager
Queue Manager provides a single view to see all the pending messages in Event Processes that are running. Click the Fetch messages count icon to see the number of delivered messages and number of undelivered messages.
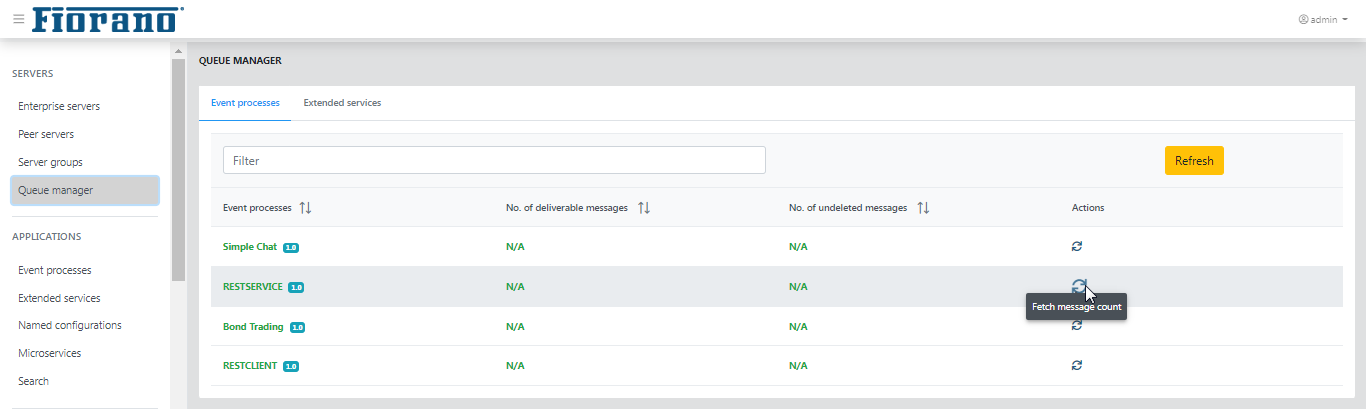
Expand to view the queue details such as event process name and peer server.
Applications
This section shows the details of the event processes running on the Fiorano Peer Server, helps to import applications, and also to monitor performance.
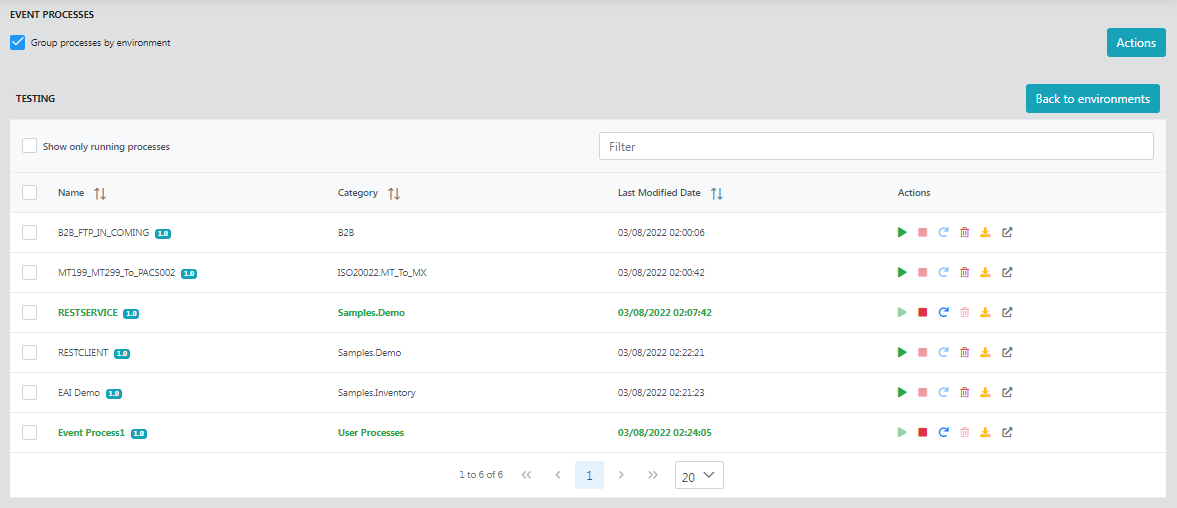
Event Processes
The page shows the list of event processes saved in the Fiorano Server.
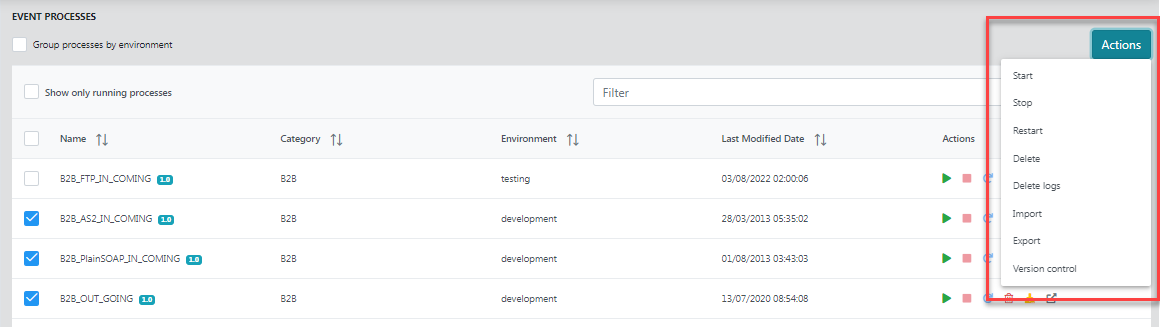
Options in the Actions column provide capabilities to launch, stop, restart, delete and download an event process. Likewise, the Action button does it for multiple event processes; that will be explained in the Actions option section below.
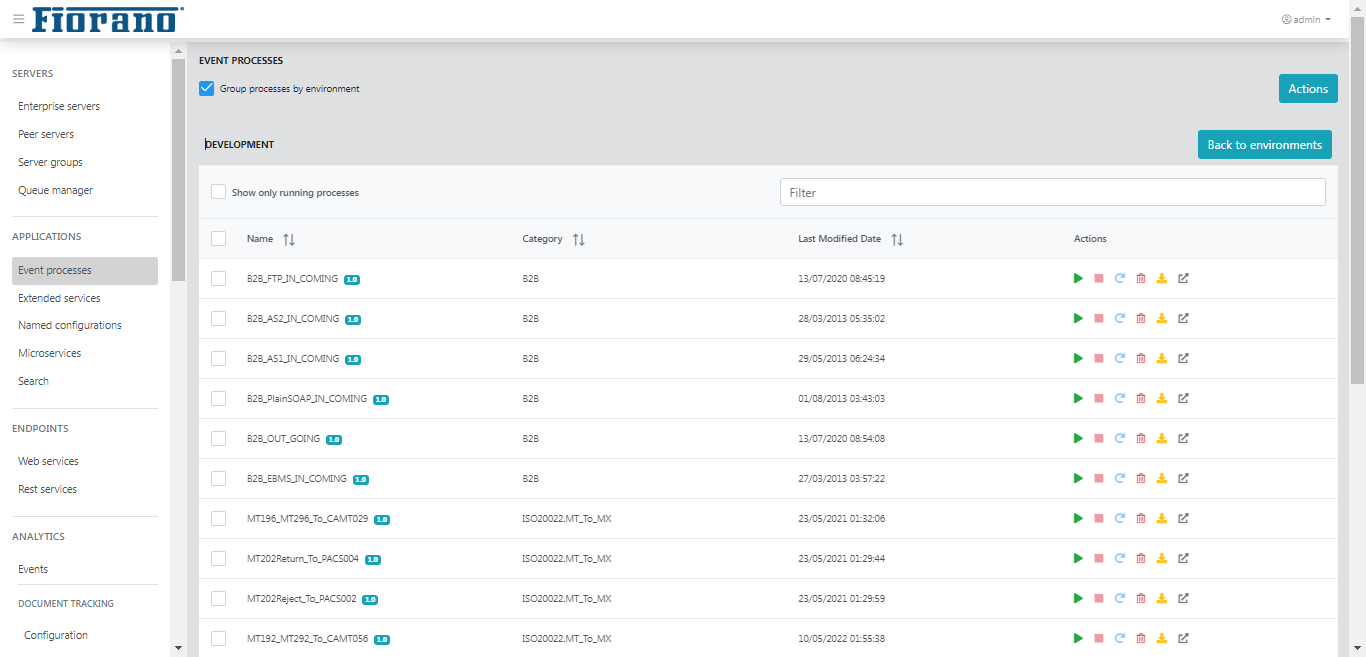
Group process by environment
Selecting this option lists the number of event processes present and running, which are segregated based on the environment.
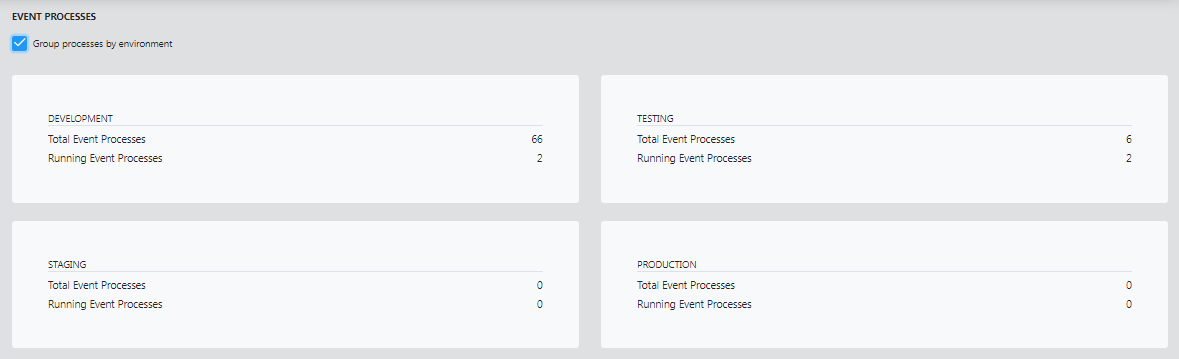
Click the particular environment to list the event processes in that environment.
Show only running processes
Click this option to display only the list of processes that are running.
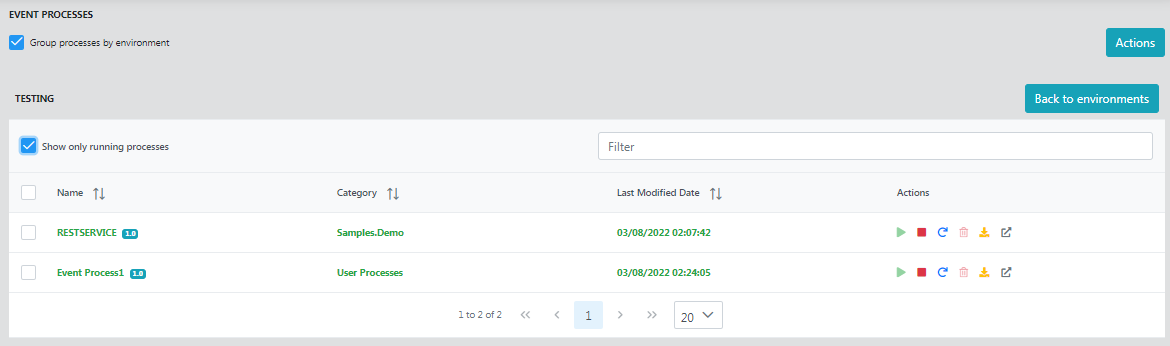
Click the Details link of an event process to list those Service Instances which are part of the event process.
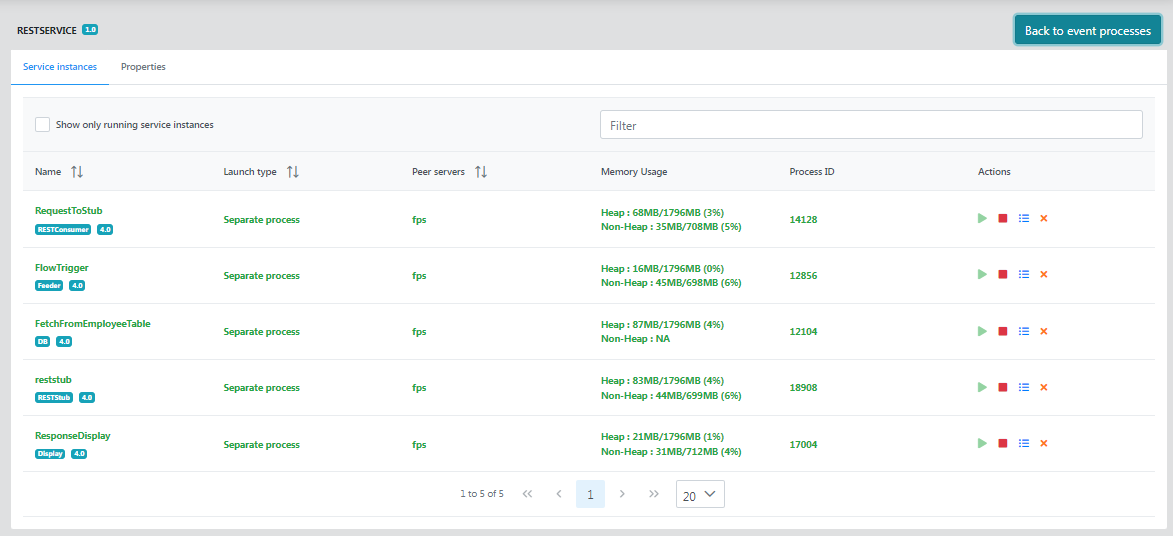
Service Instances
The details page shows services instances that are part of the selected event process the name, launch type, and peer server name.
Options in the Actions column provide capabilities to stop a running service and start a stopped one. It also has options to view and delete output and error logs.
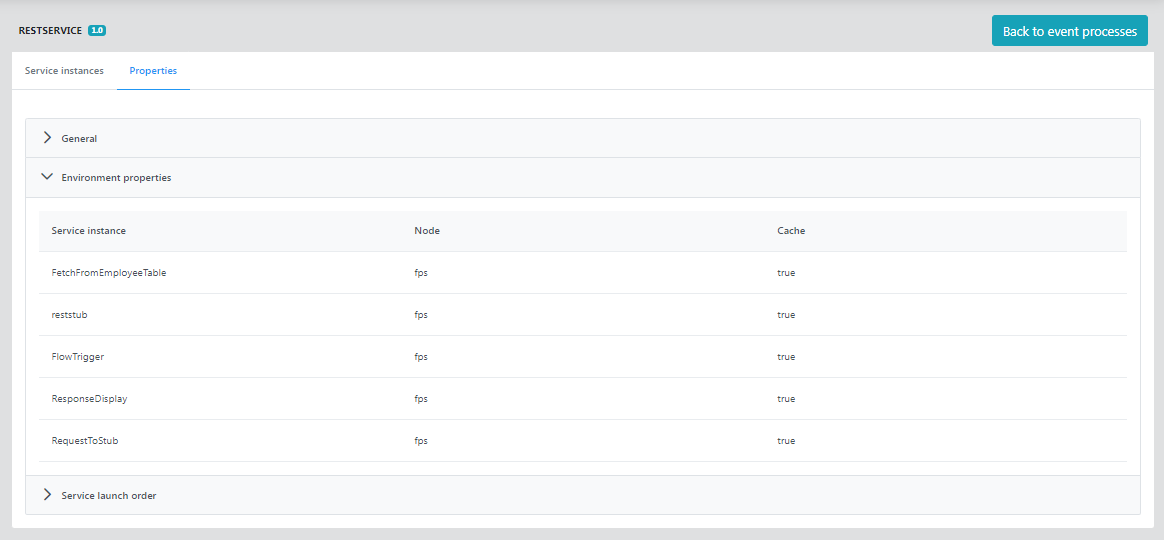
Properties
Displays Event Process properties as configured in eStudio such as General, Environment properties, and Service launch order.
Actions option
As mentioned in the Event Processes section, there are options to launch, stop, restart, delete and download under the Actions column of each event process. Likewise, to perform these actions for multiple event processes, use the Actions button.
Importing an event process
Import option helps to import an event process or multiple event processes which are exported/downloaded or saved as a Zip file in a particular location.
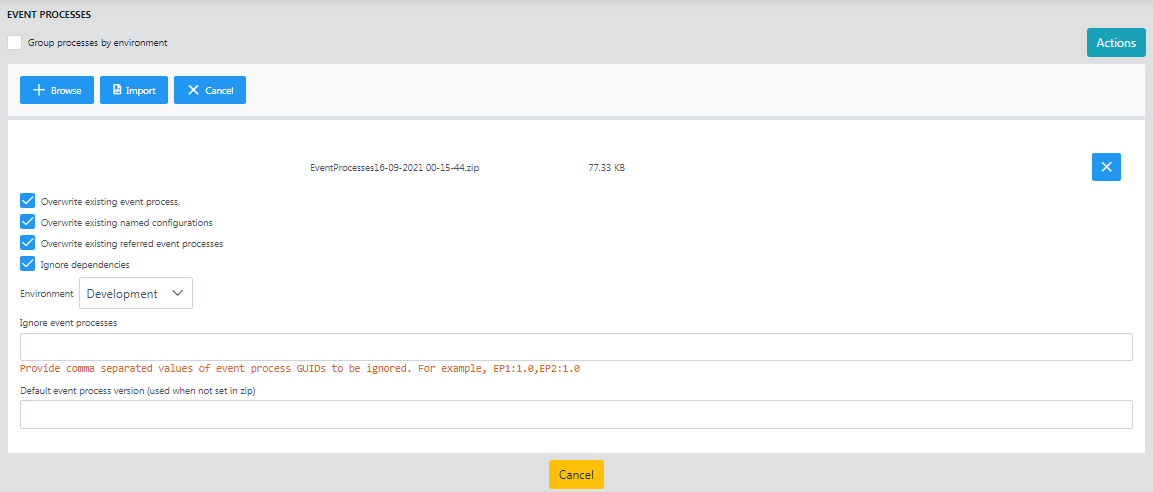
To import, click the Browse button to select the Zip file, provide the following details, and click Import.
| Property | Description |
| Overwrite existing event process |
|
| Overwrite existing named configurations |
|
| Overwrite existing referred event processes |
|
| Ignore Dependencies |
|
| Environment | Choose the environment to which the event process needs to be imported; options being Development, Testing, Staging, and Production. |
| Ignore event processes | In a ZIP file with multiple EPs, specify the comma-separated names of the EPs that need not be imported along with the other EPs in the file.
|
| Default application Version (used when not set in zip) | Specify a version number if a version number was not set in the zip file. |
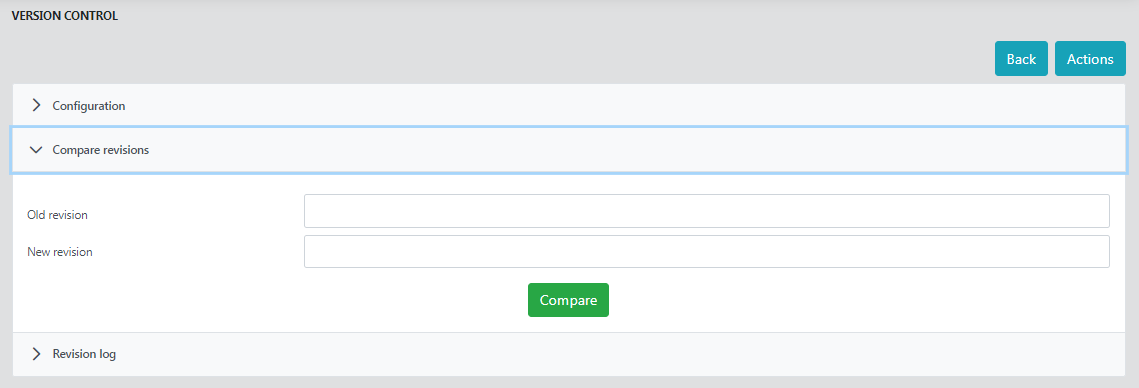
Version Control
This feature enables version control Integration for Event Processes. It helps in configuring GIT, comparing revisions and viewing revision logs in the GIT version control repository.
Configuration
Username and Password are the version control username and password. The URL string is the remote URL location to perform push, pull or checkout of the commits from eStudio or API management dashboard.

Compare revisions
Compares the files modified/added/deleted between any two commits in the applications directory.
To compare, provide the old and the new revision numbers and click Compare.
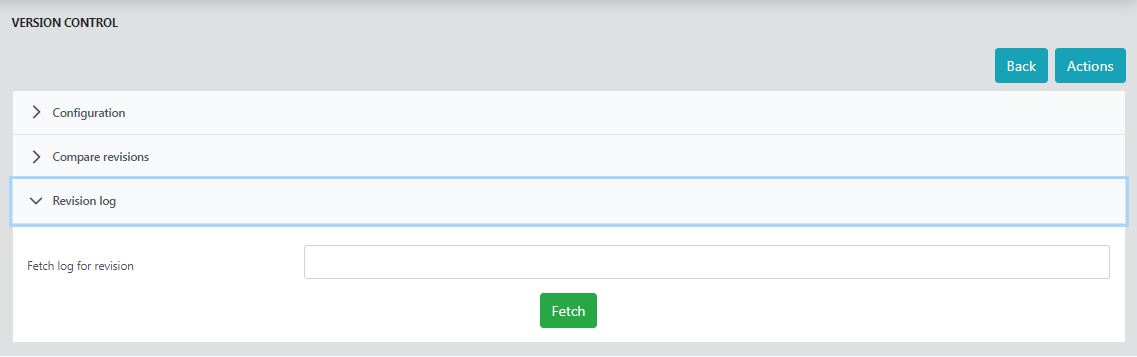
Revision log
To list all the files pushed from the applications directory to remote repository during a particular commit, use the Revision log option.
Provide the revision number which gets printed on the server console after every successful push and click Fetch.
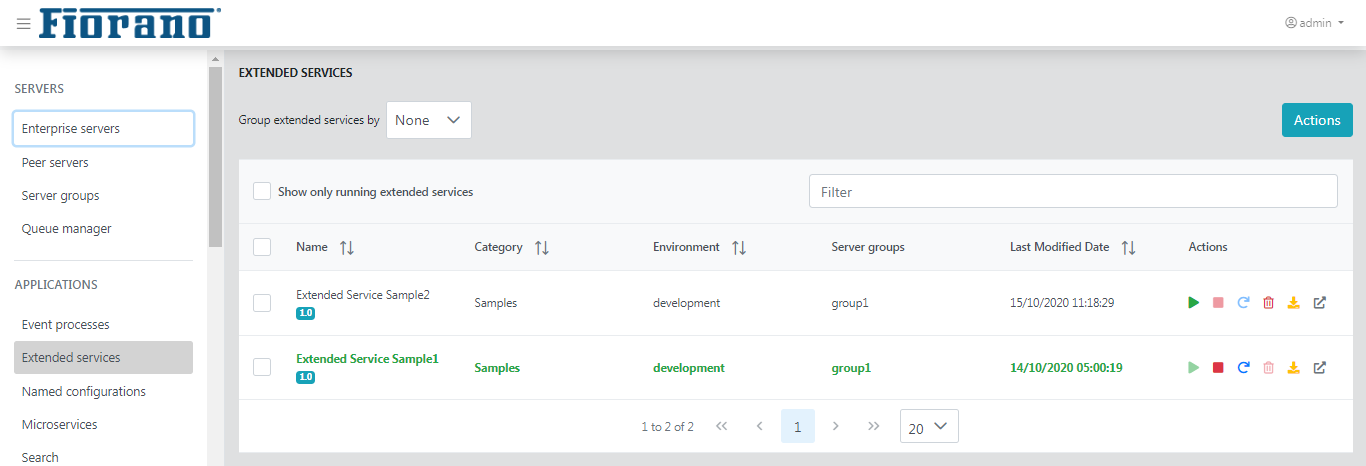
Extended Services
Displays the details of extended services such as name, category, environment, server groups, and last modified date.
The Action column provides the capability to start, stop, restart, delete and download the service. The Details page gives information about the services present in the event process.
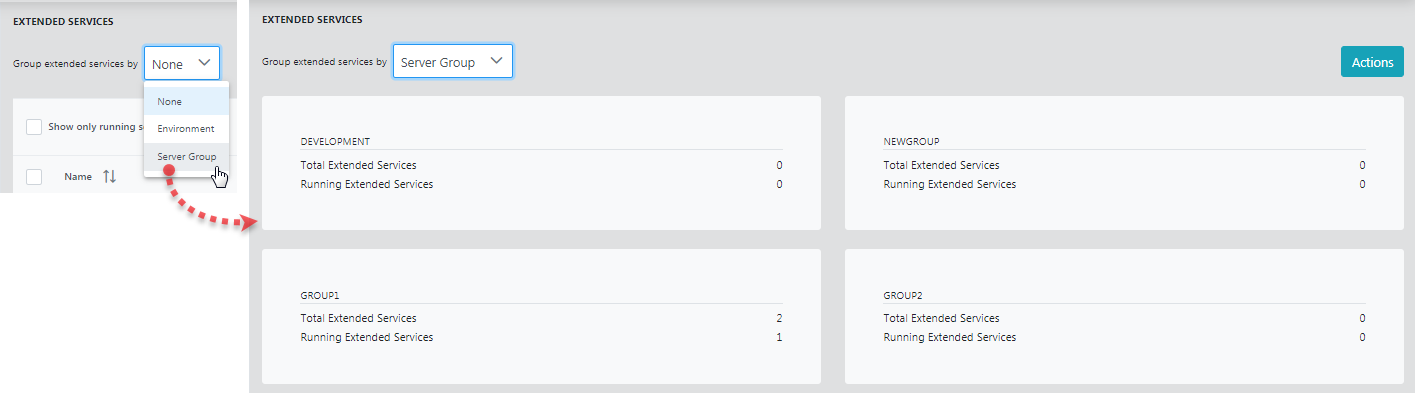
Group by Environment and Server Group
Selecting this option lists the number of event processes present and running, which are segregated based on the environment or server group.
Named configurations
Grouped by Category by default.
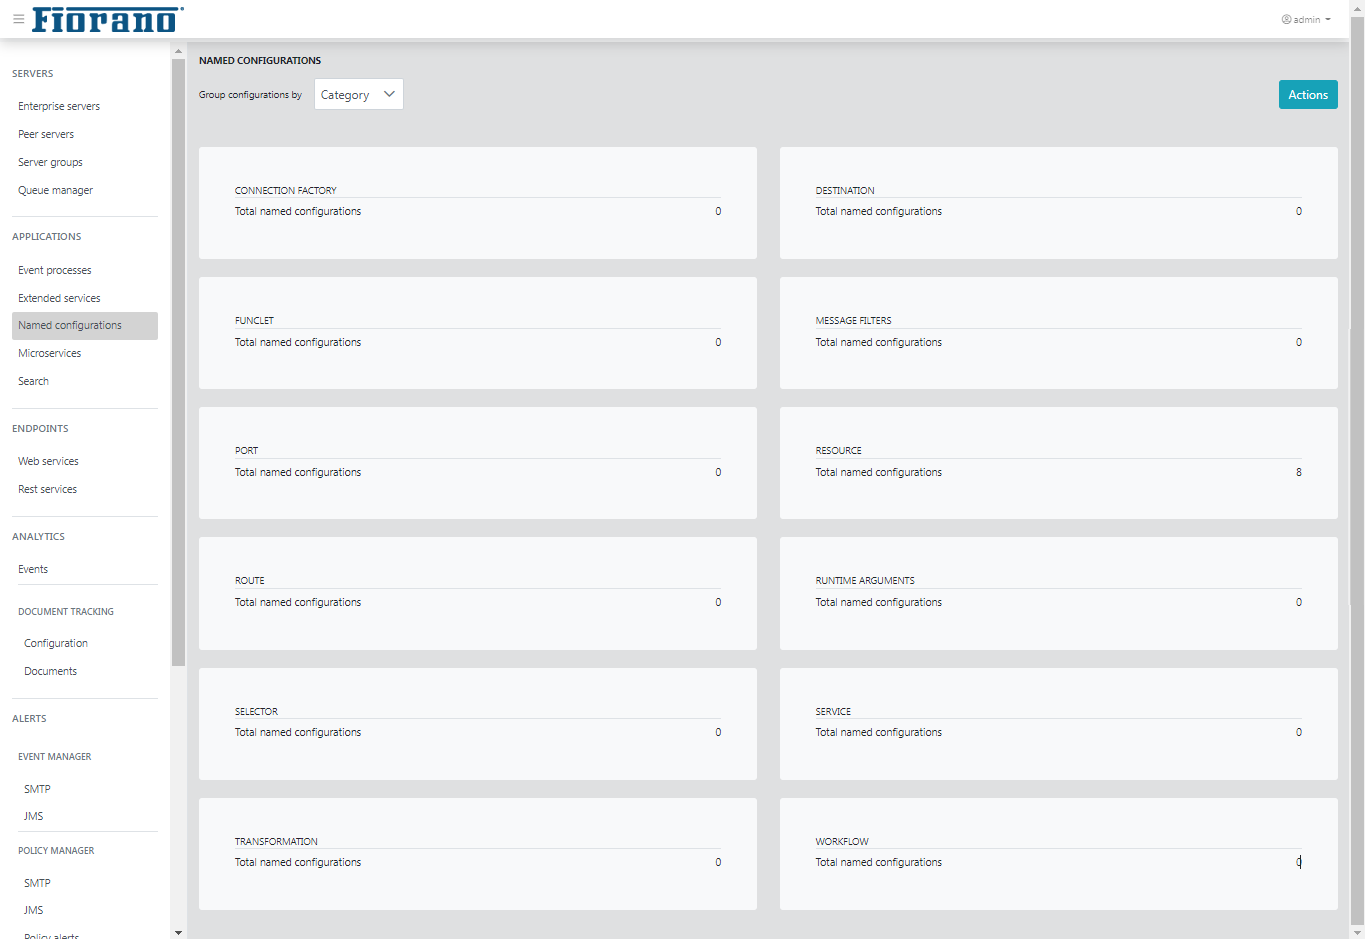
Can be grouped by environment too.
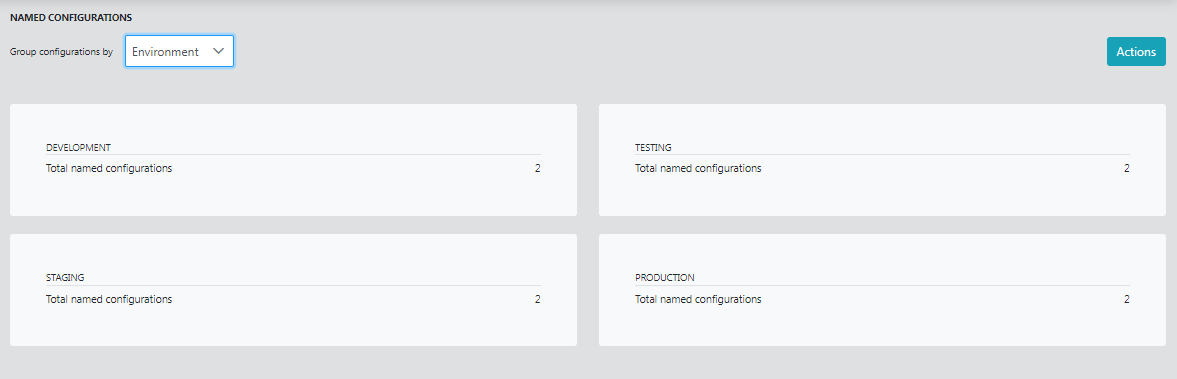
Click the category/environment to see the named configuration details of the respective category/environment.
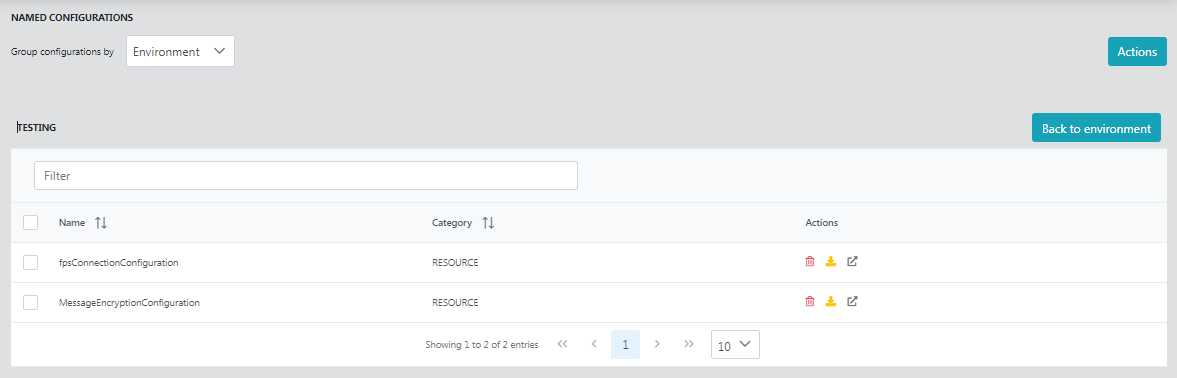
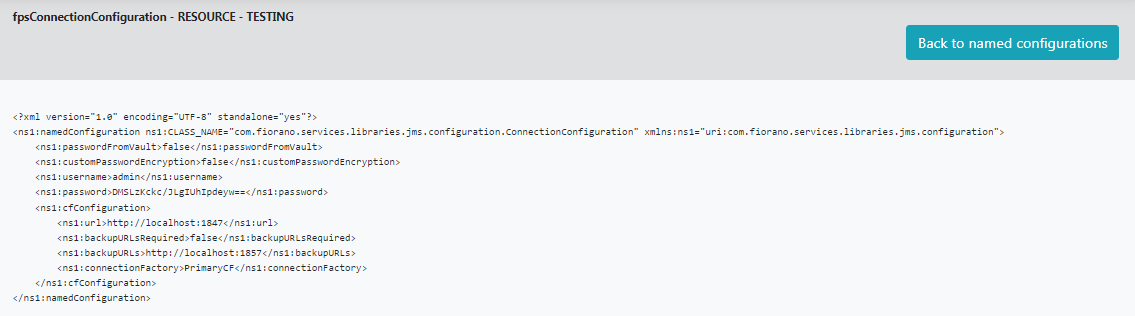
Click the Details icon to see the configuration.
Actions button provides options to refresh, export, import, and version control.
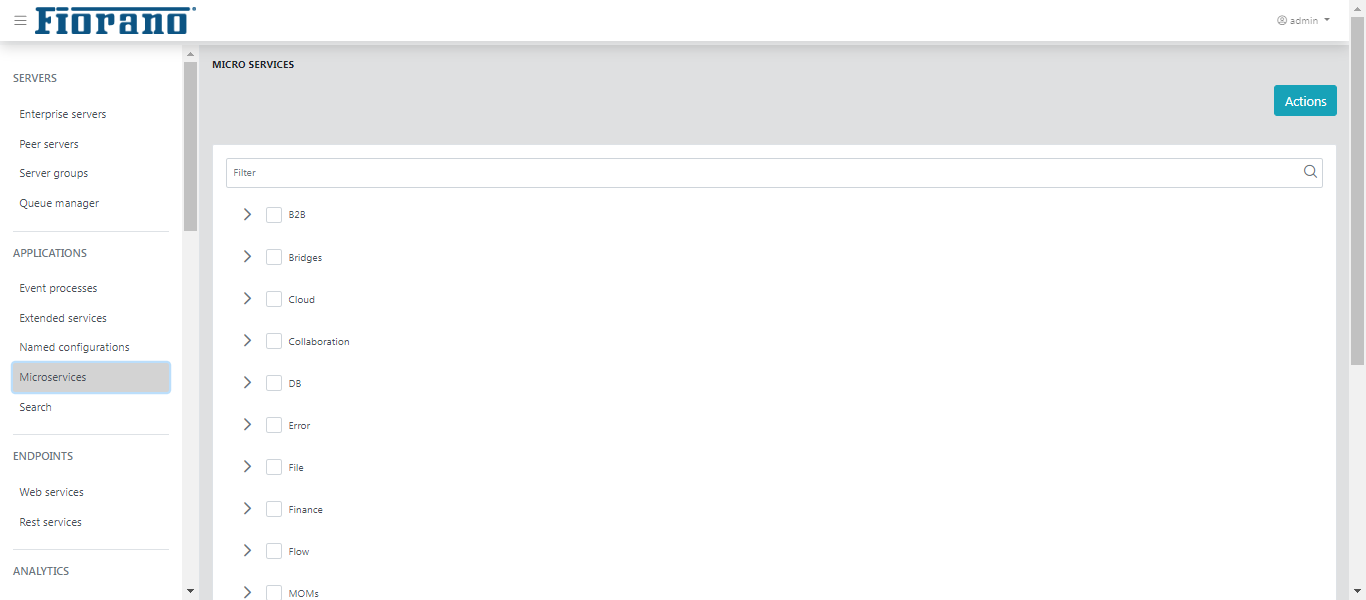
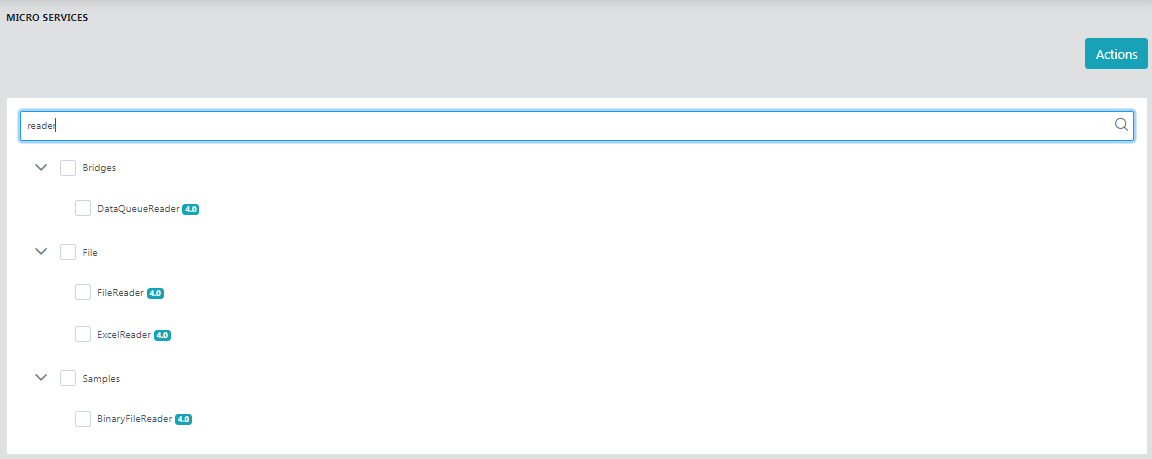
Microservices
Actions button provides options to refresh, export, import, and delete microservices.
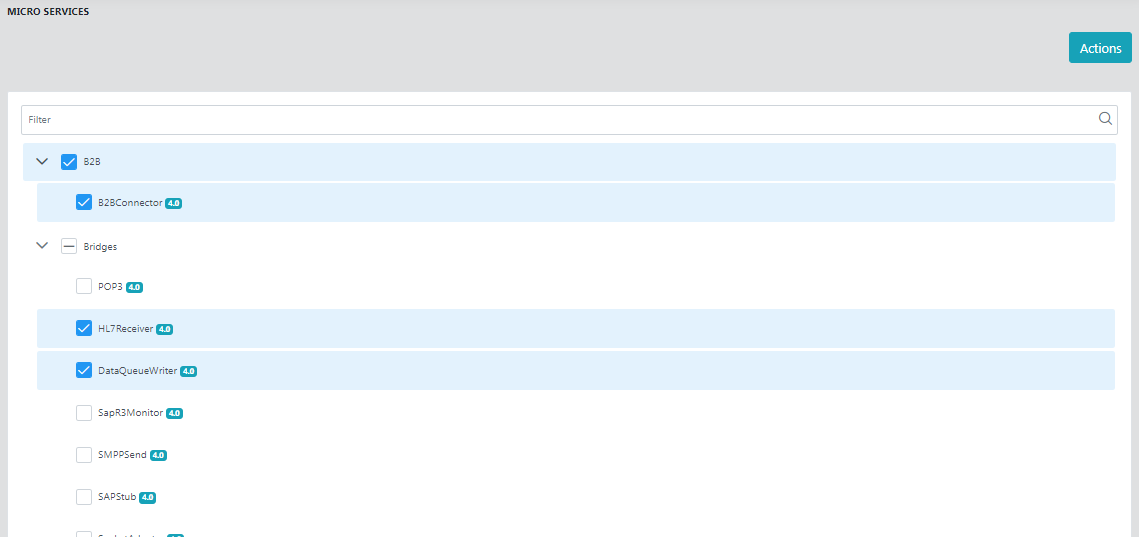
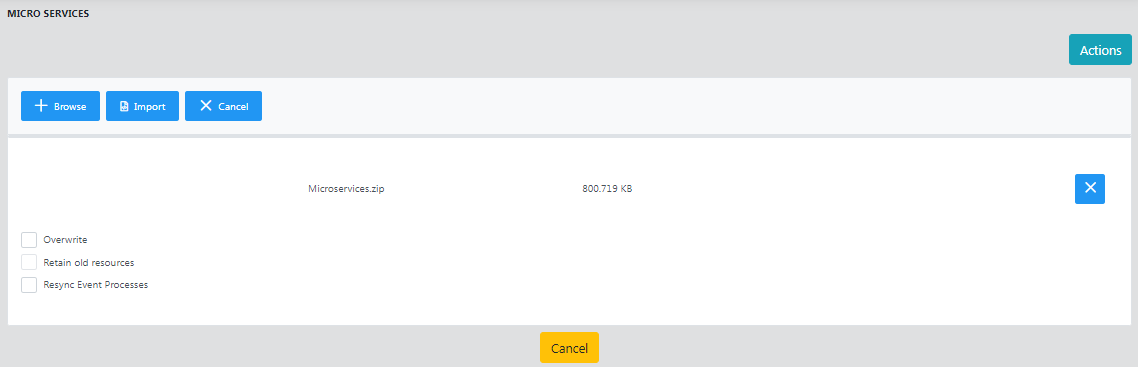
Import
Import option helps to import a microservice or multiple microservices which are exported/downloaded or saved as a Zip file in a particular location. Options available for importing microservices are:
- Overwrite: Replaces the microservice(s) with the one that exists in the repository with all properties and resources of the importing microservice.
Retain old resources: Overwrites the microservice retaining the resources (jars, property files etc.) present in the old microservice in the repository.
Resync Event Processes: If the importing microservice is part of an event process that is running, this option helps to re-synchronize and apply the modifications to the running event process.
Search
This section provides the capability to search for resources that are configured to be used by event processes, which can be performed on three different levels:
- Applications View
- Microservices View
- Resources View
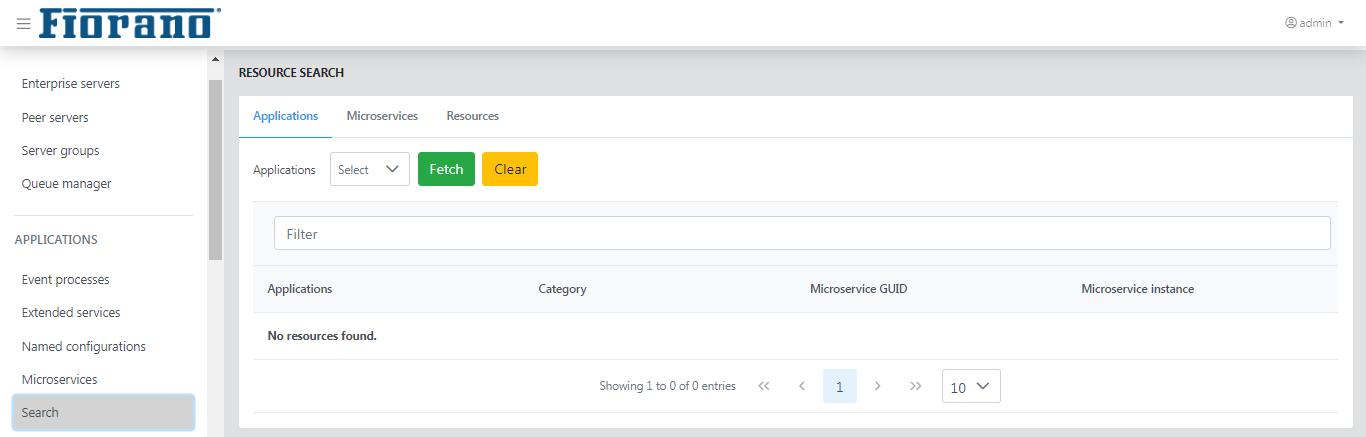
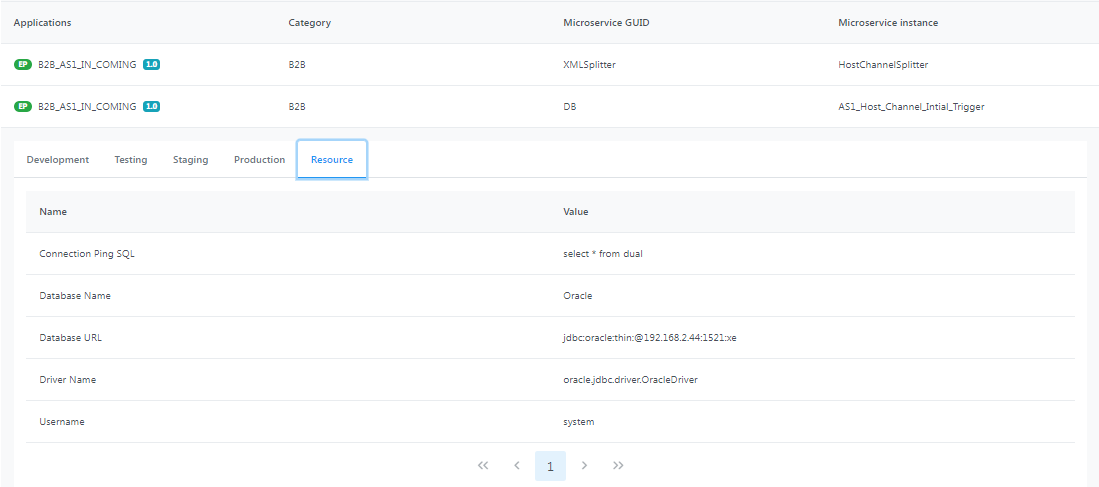
Figure 57: Searching configured resources based on application view
In all three options, use the drop-down to select the application/microservice/resource in resources that need to be searched for.
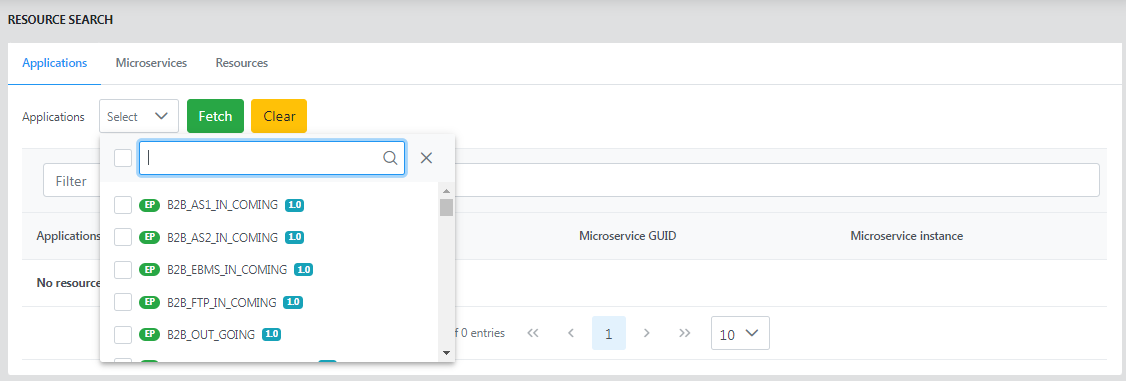
Applications
The Applications page shows details such as applications (name), category, microservice GUID, and microservice instance.
Click a row to display the resource names and values in different environments.
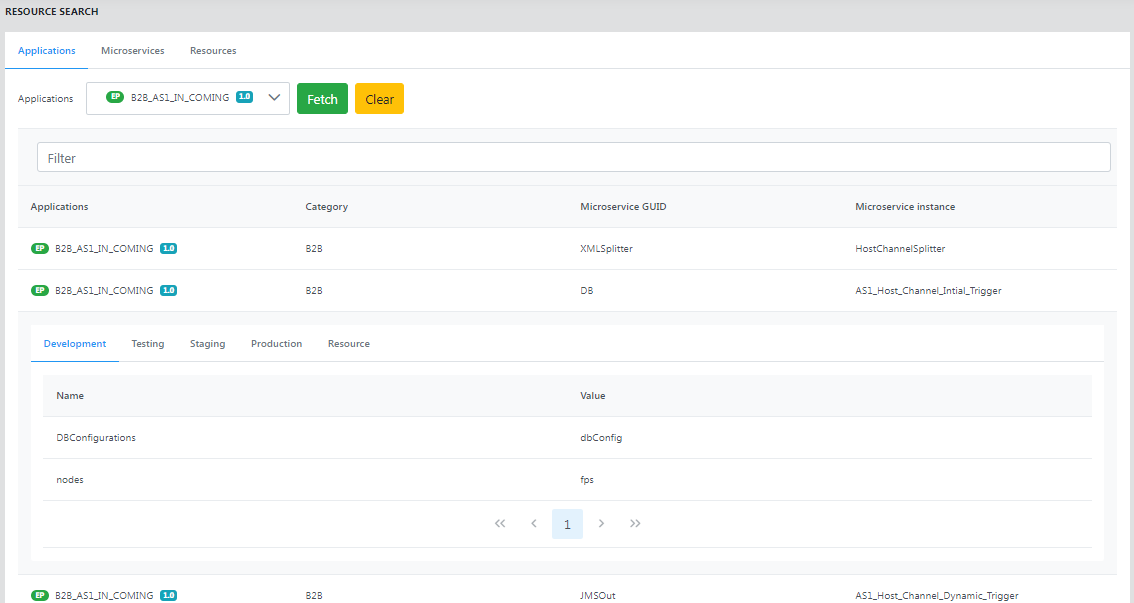
Click the Resource tab under the specific application to see more details about the resources in it and the corresponding values.
Microservices
The Microservices page shows details such as Applications, Category, Microservice GUID, and Microservice instance.
Click a row to display the resource names and values in different environments.
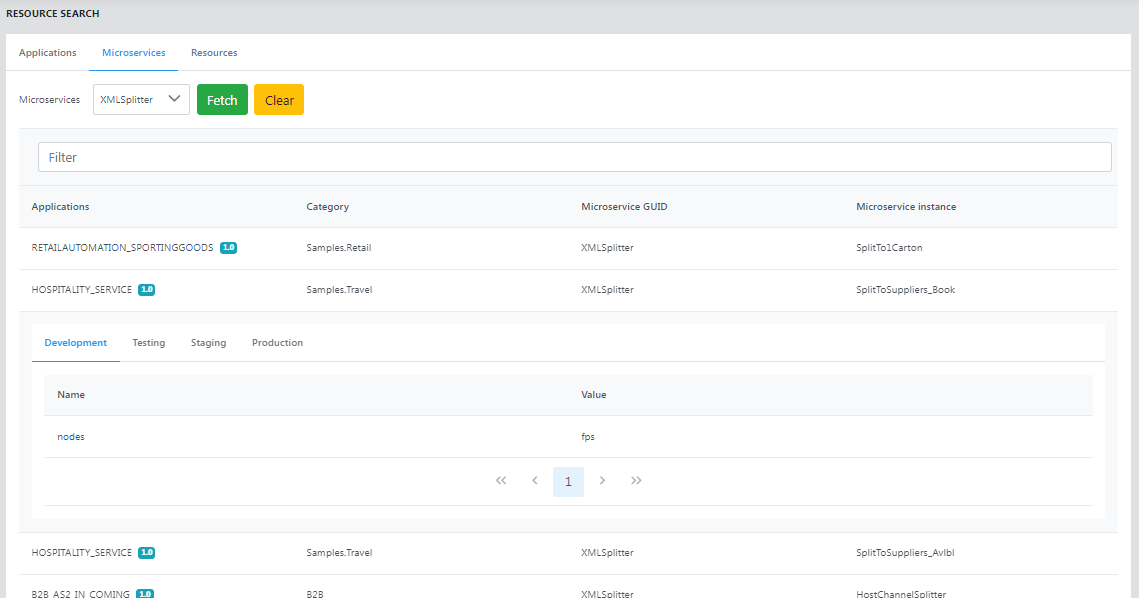
Figure 58: Searching configured resources based on the Microservices view
Resources
The Resources page shows details of the resources such as Value, Environment, Applications, Category, Microservice GUID, and Microservice instance.
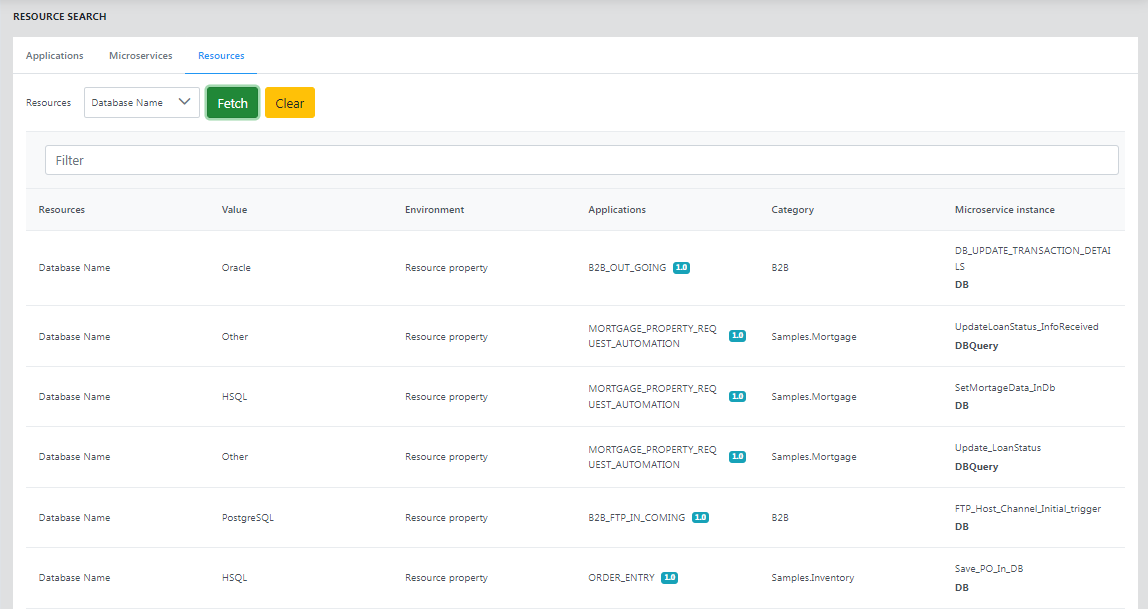
Figure 59: Searching configured resources based on resource view
Endpoints
This section provides details of the event processes deployed as Web Services and RESTful services. You can view the status of web service either online or offline and has the option of enabling or disabling this option. You can also test RESTful deployed from the dashboard.
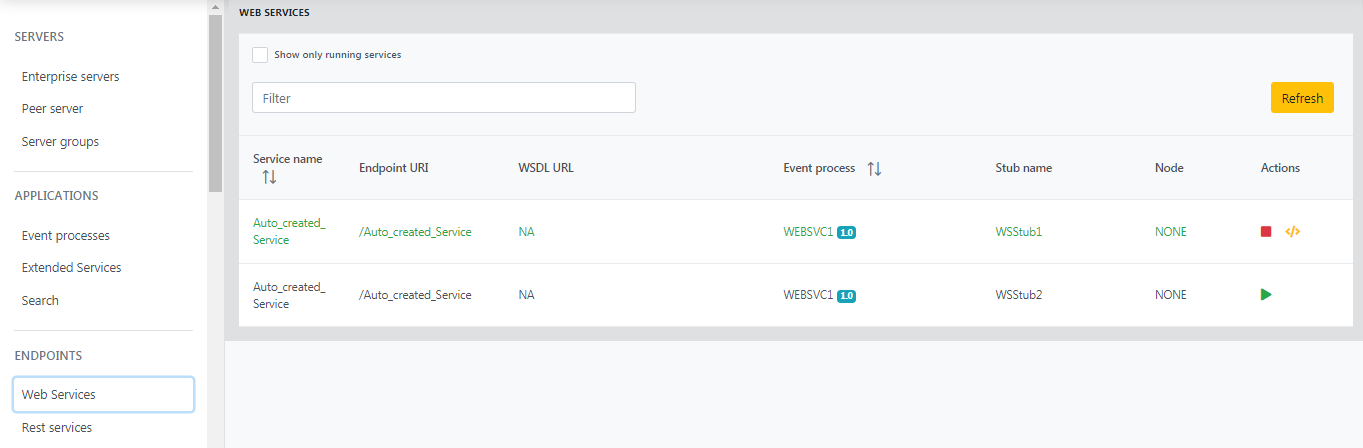
Web Services
The Rest service event processes will be displayed with details such as service name, endpoint URI, WSDL URL, event process name, Stub name, Node, and Actions.
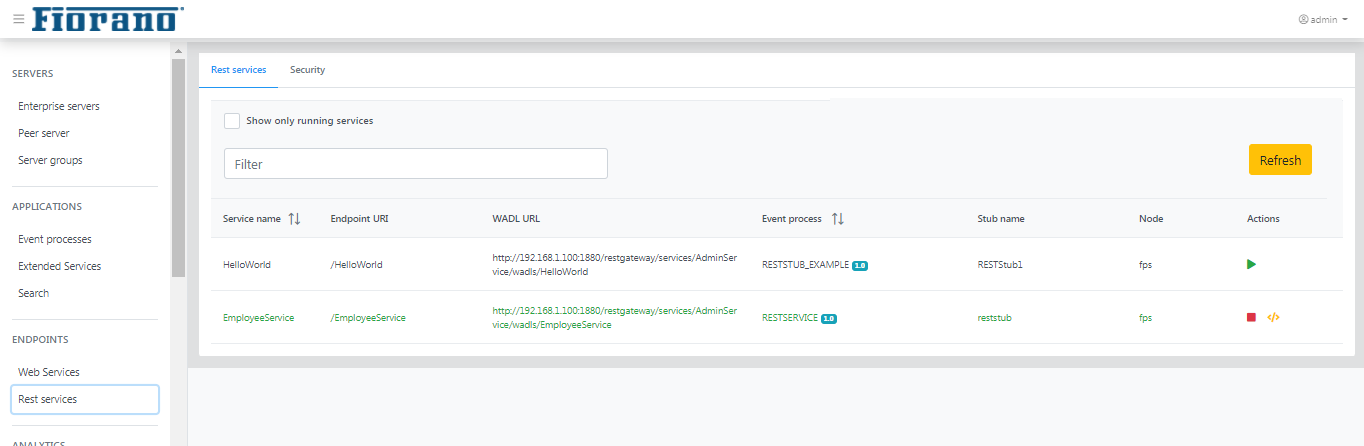
Rest services
The Rest service event processes will be displayed with details such as service name, endpoint URI, WADL URL, event process name, Stub name, Node, and Actions.
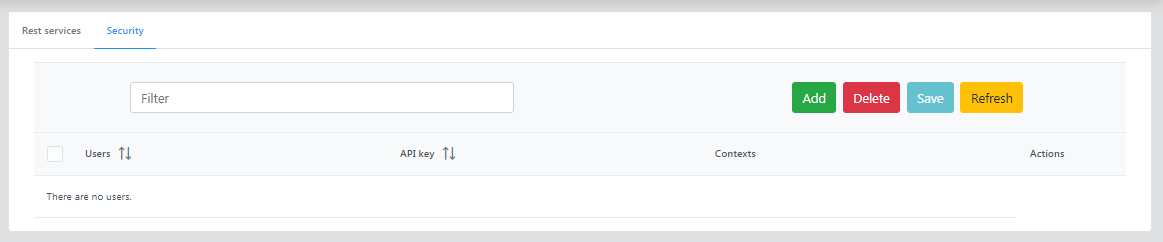
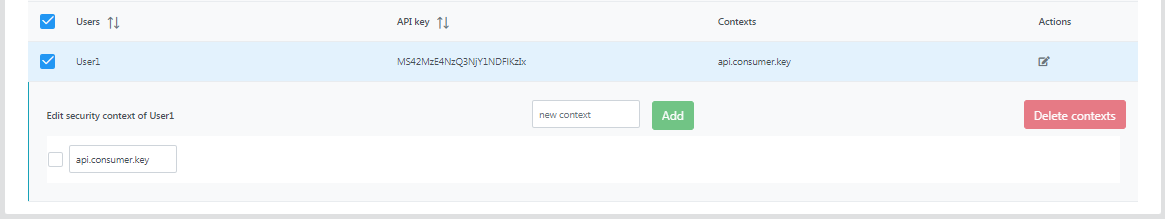
Security
Click the Add button to add a user with security attributes defined.
Provide the username, context name and API key and click the Add user button.
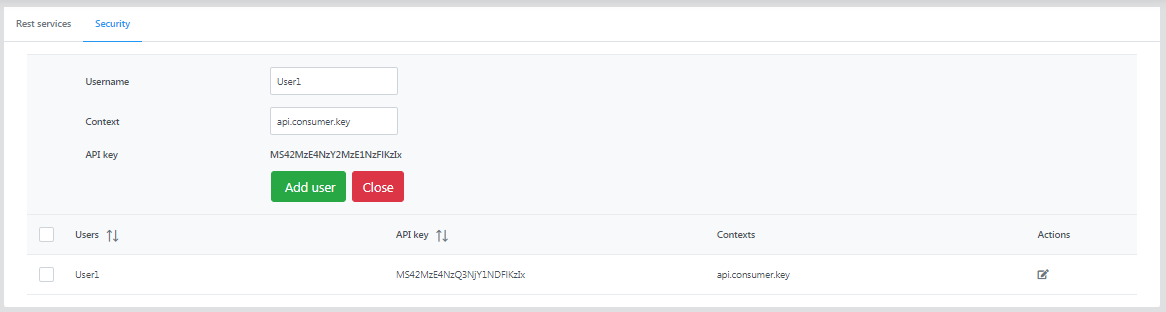
Click the edit button under the Actions column to add a new context to the user.
Analytics
Events
Provides the details of the events generated by the Fiorano Enterprise Server (FES), the Fiorano Peer Server (FPS), Applications, Services, Security, and the SBW exceptions that occur while running various event processes.
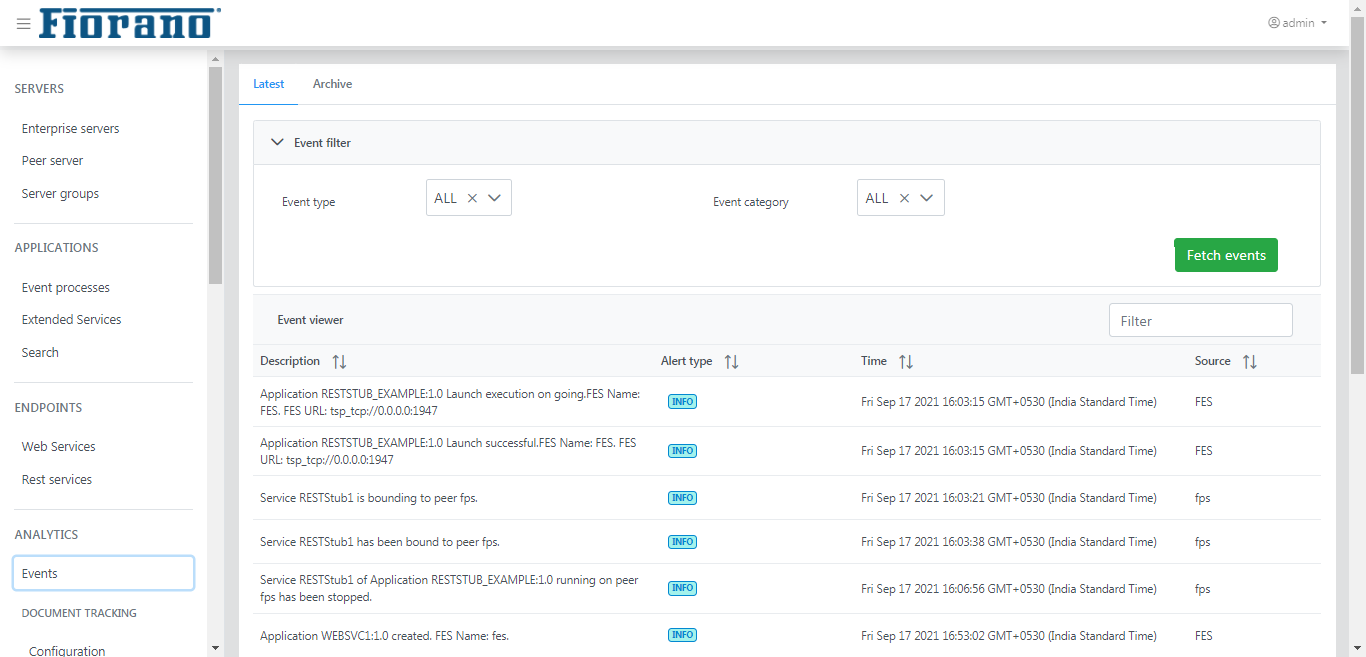
Figure 13: Events tab showing the latest events
The Event tab has two sections which are explained below.
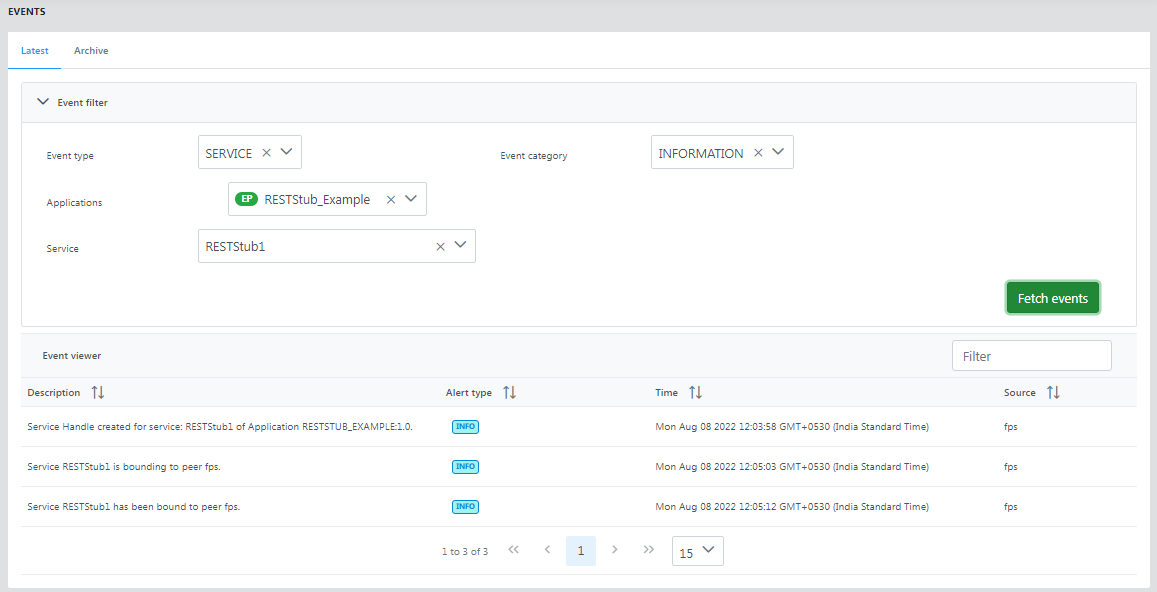
Latest
This gives the list of the latest events generated by the enterprise server and peer servers.
To filter specific events, use the Event type and Event category from the options listed below and click the Fetch events button.
| Event type | Event Category |
|---|---|
|
|
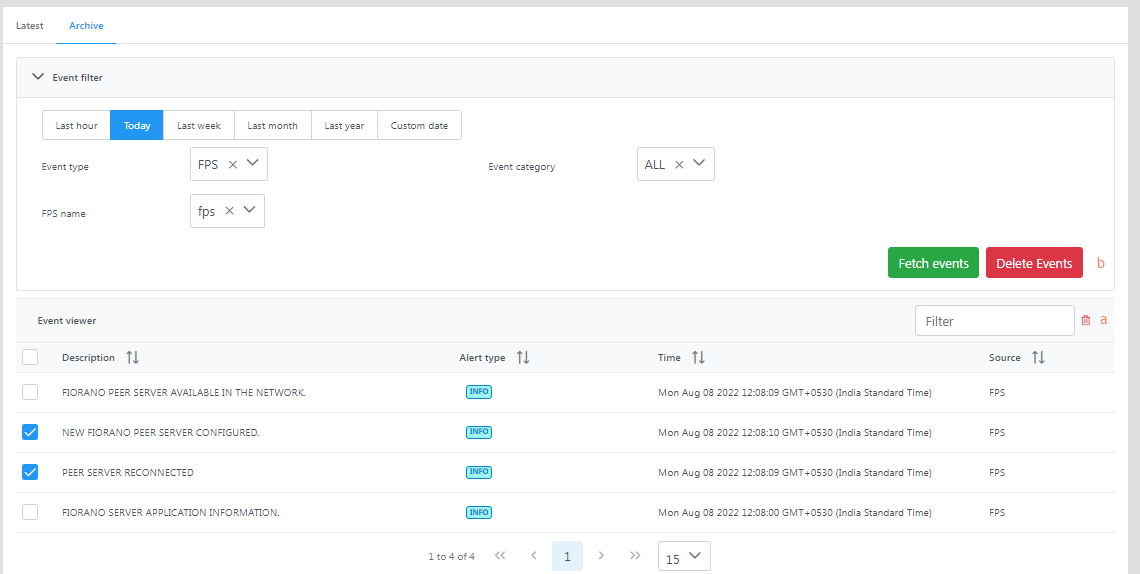
Archive
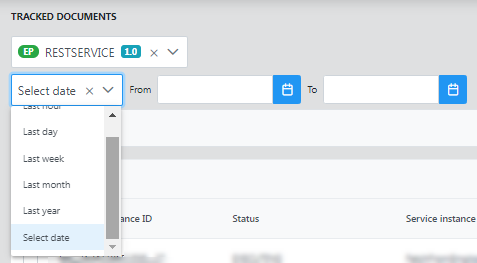
In this section, those events which are archived over a period of time in the database can be filtered using various date ranges.
The event type and category are as explained in the Latest section above. The date range that can be selected is based on the hour, day, week, month year, and customer date where specific start and end dates can be provided in the DD/MM/YYYY HH:MM format.
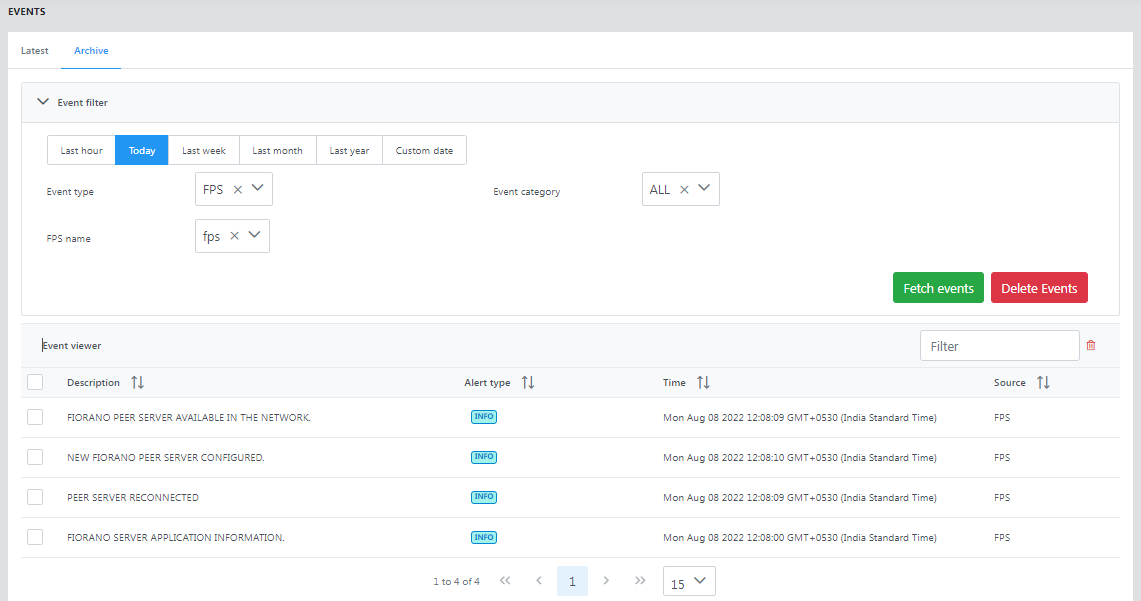
Deleting archived events
To delete events, perform the following action accordingly:
- Single or multiple events: Select the relevant event(s) and click the Delete icon.
- All events: Click the Delete Events button.
Document Tracking
The document tracking feature is configured as part of FES to track SBW events into the database running within Enterprise Server.
Document Tracking is enabled from eStudio. Refer to the Enabling Document Tracking section to know how to enable Document Tracking in a Workflow of an Event Process and hence track them in the Dashboard.
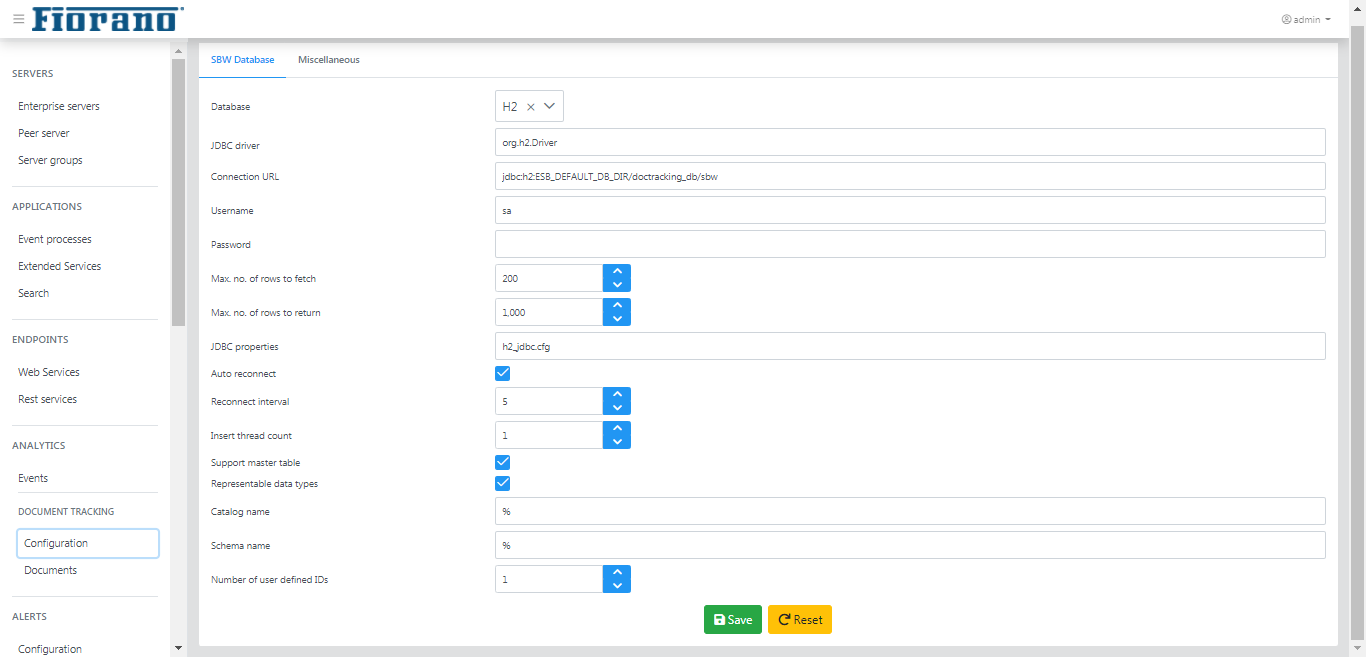
Configuration
By default, the tracked documents are set to be stored in the H2 database that runs inside the Enterprise Server. The section below allows configuring an external database for Document Tracking.
SBW Database
Provide property values of the database and click Save to assign the database.
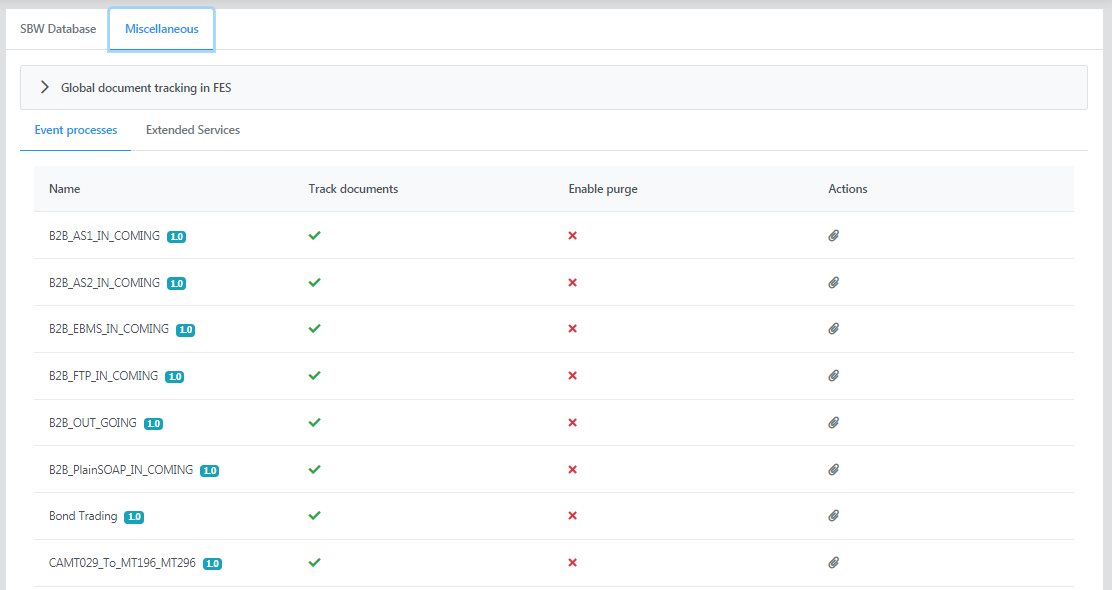
Miscellaneous
This section displays the event processes and extended services for which documents can be tracked and it allows to set global settings for event processes to enable/disable tracking globally in FES and purge document can be set for multiple documents.
Global document tracking in FES
Click to expand this option to configure tracking details as below.
Enable document tracking for event processes and extended services globally in FES
Enable this option to enable document tracking for event processes and extended services globally in FES.
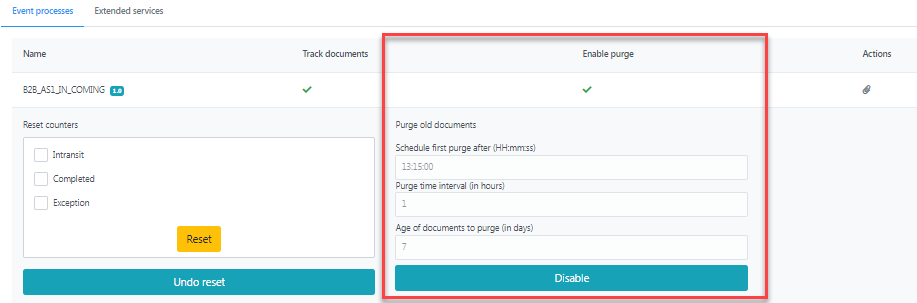
Event processes
This section not only shows the event processes for which documents can be tracked as well as purging can be enabled, but can configure to reset counter and to purge old documents of a selected event process too. The indication under the columns Track documents and Enable purge change based on the change in settings.
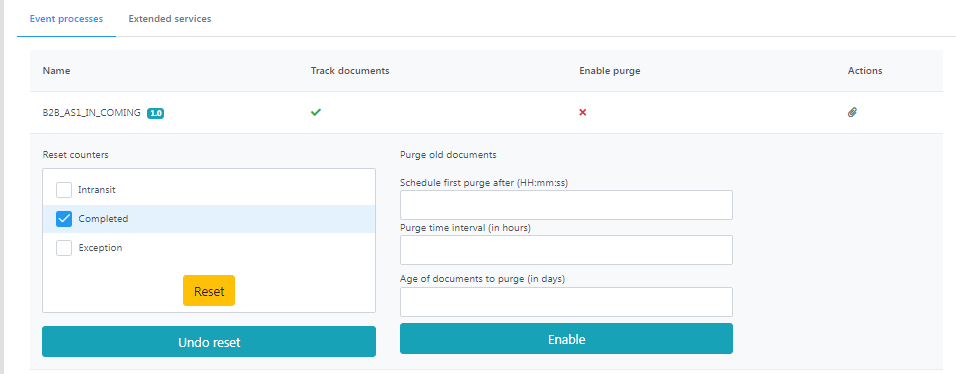
Click the attachments icon under the Actions column to make changes to
Reset Counters
The counters can be reset for the following types of counters; all or any one of these:
- In Transit
- Completed
- Exception Documents
Select the options and click the Reset button.
To revert the counters, click the Undo reset button.
Purging SBW documents
This option helps to purge SBW document records from the database. Purging can be done based on
- a scheduled time for a particular application
- a scheduled time for multiple applications
- instant deletion of an application or multiple applications
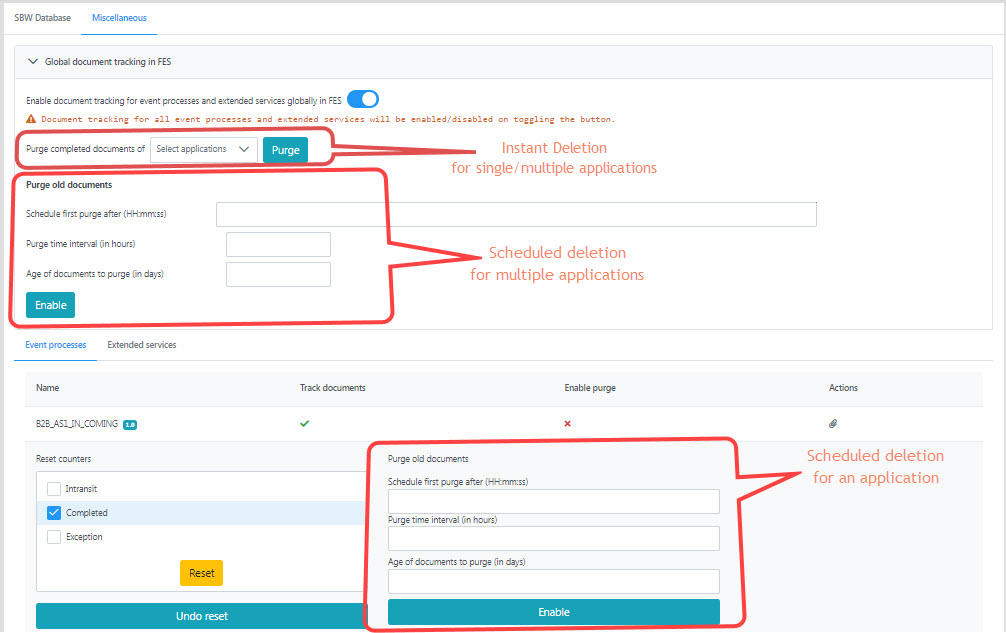
Purging SBW documents of an application
Document tracking records take up a substantial amount of disk space on the enterprise server over time. A scheduled deletion by discarding old entries can be performed to manage disk space in the Document Tracking Database.
The Purge old documents option allows scheduling a task for purging old SBW document records of the selected event process from the database in the following manner:
Schedule first purge after: Time, in 24 hrs format, at which the task would execute.
- Purge time interval (in Hrs): Interval at which task of deleting docs would execute.
Age of documents to purge (in days): Documents older than this value will be deleted.
Click the Enable button after providing these values.
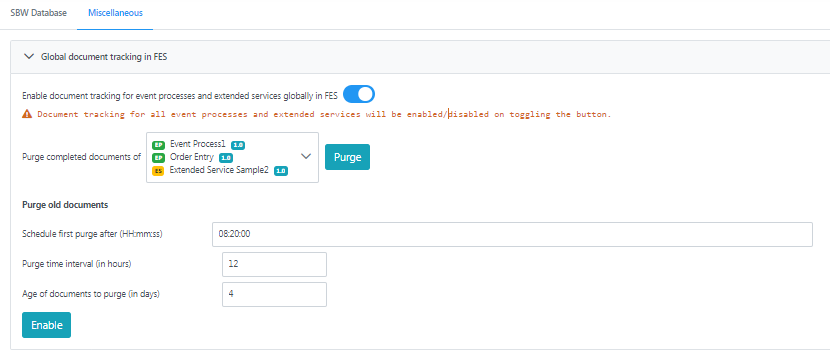
Purging SBW documents of multiple applications
Purging can be set for multiple documents as well by performing the following actions.
- Expand the Global document tracking in FES option on top of the page.
- Select the applications for which purging needs to be enabled from the Purge completed documents of drop-down.
- Under the Purge old documents section, provide values as explained in the section above and click the Enable button below it.
Purging SBW document records instantly
Tracked documents records of applications stored in the database till the moment can be instantly deleted. To perform this, after selecting the applications as mentioned in the above section, click the Purge button against the Purge completed documents of drop-down.
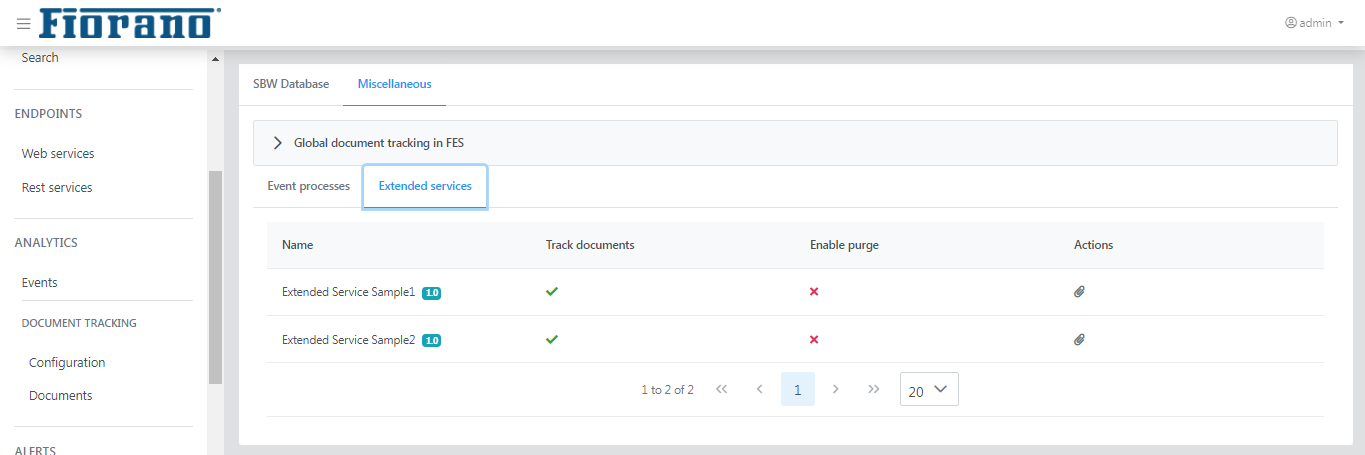
Extended services
This section shows the event processes for which documents can be tracked. It has all the functions available in the Event processes section; please refer to the Event processes section.
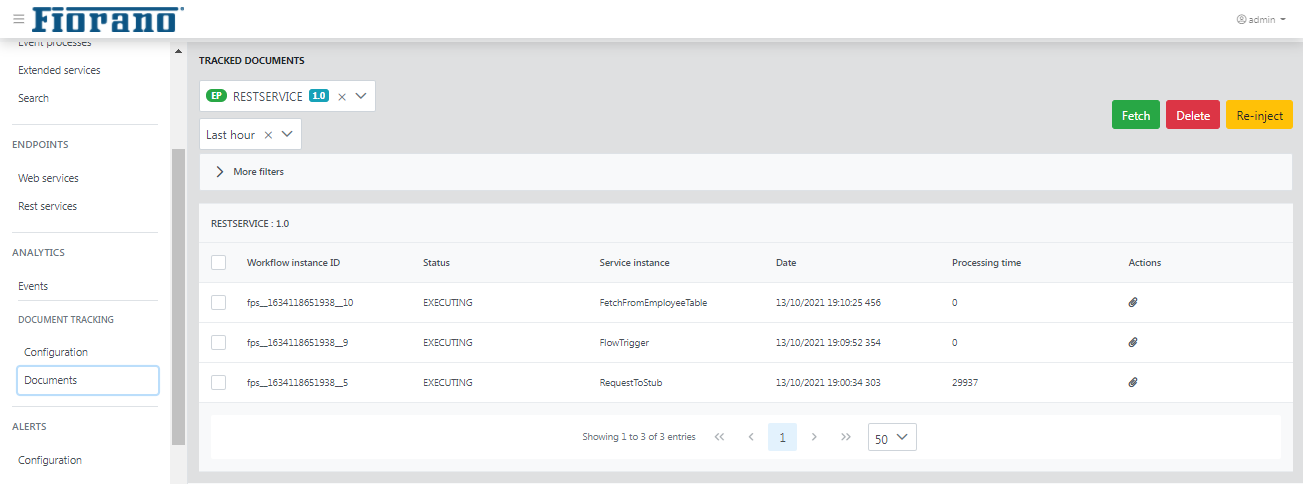
Documents
In this section, the tracked documents or the event processes for which SBW workflow is set can be fetched, details of each document can be viewed and deleted, and more importantly, the message and its properties can be edited and reinjected for those messages that face exception or reach the exception port.
Searching SBW Documents
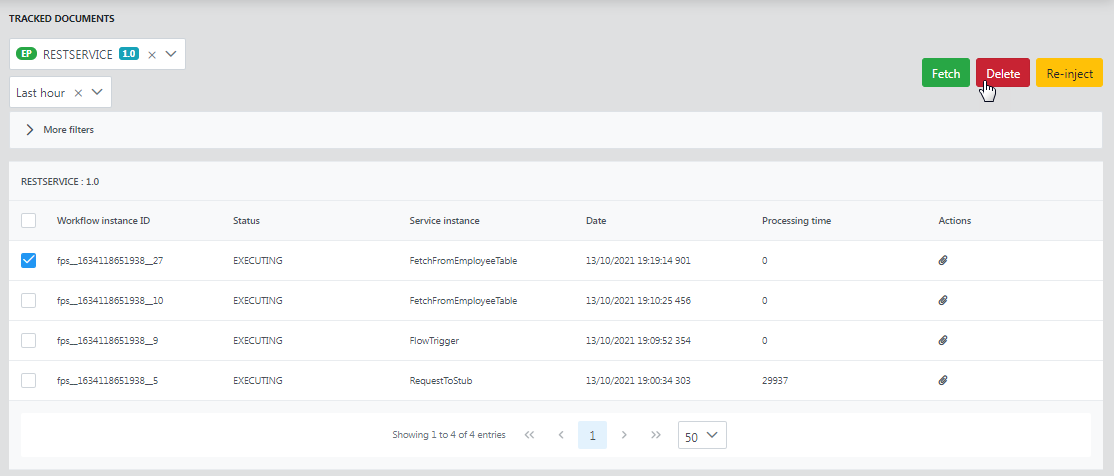
Select the application that needs to be tracked from the drop-down and click the Fetch button to display the details of the tracked documents such as Workflow instance ID, Status (executing/executed), Service instance, Date, and Processing time.
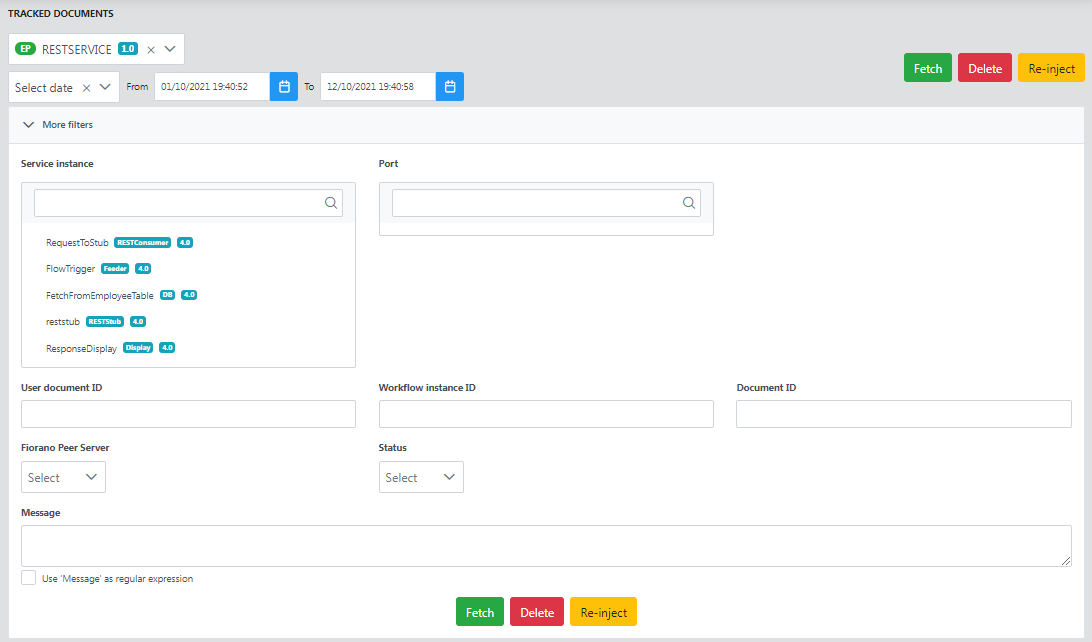
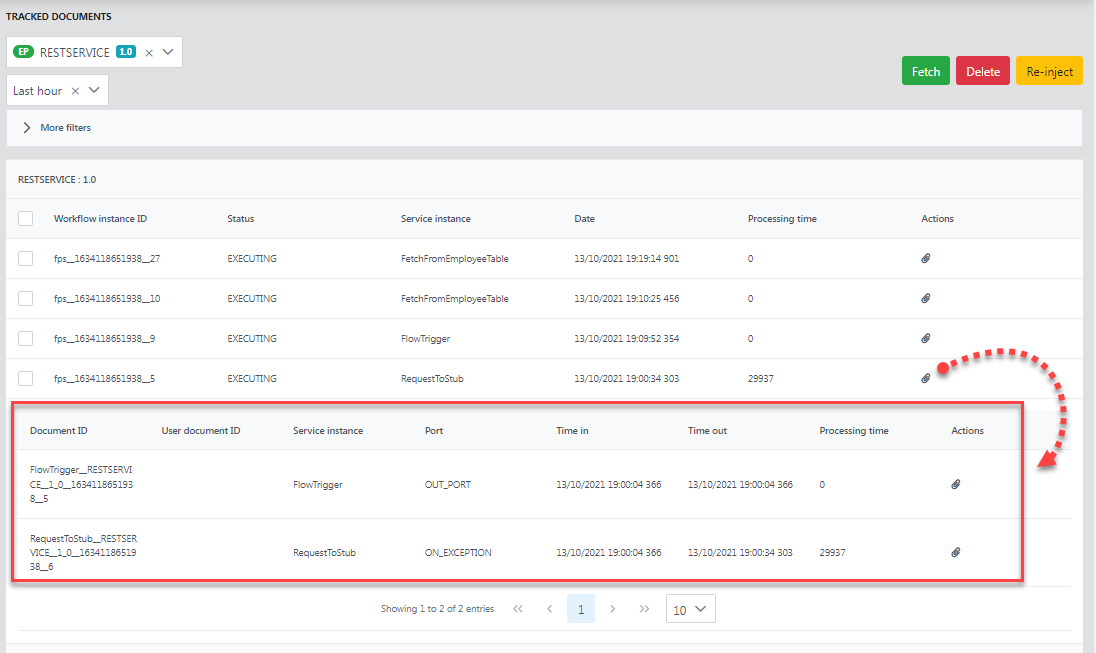
Click the details button for a particular workflow instance to see the details of the workflow such as Document ID, User document ID, Service instance Port, Time in, Time out, and Processing time.
Re-injecting Documents
Documents can be selected as per choice and re-injected using the ReInject Selected Documents button present in the upper-right part of the screen. This is mainly used to re-inject failed documents, that is, the messages that reach the exception port.
Steps
- Click the details icon (see the image above) under the Actions column of a document that is on the exception (ideally, as reinjecting is generally for resolving errors) port to see the details such as message body, general details, properties, carry forward context, application context, attachments, and source contexts.
- Click the Edit to re-inject button to edit the properties mentioned above.
- Make the required changes and click the Reinject button to trigger the edited data.
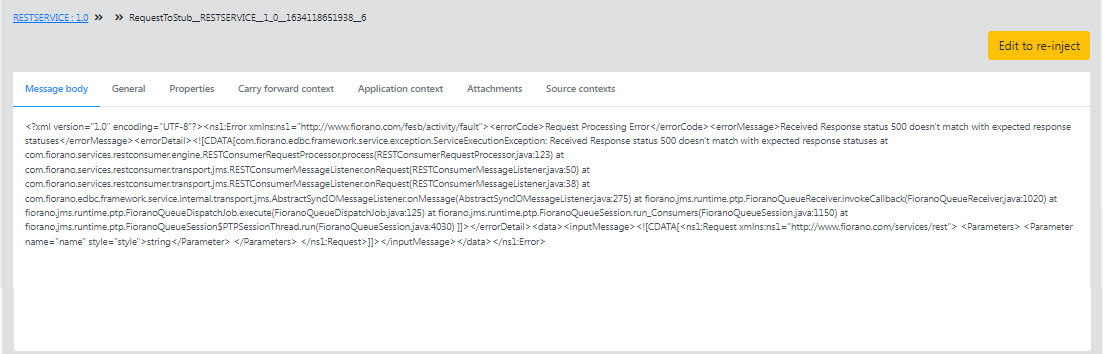
Figure 30: Tracked document
Deleting Selected Documents
To delete a document or a set of documents, select the record(s) and click the Delete button.
Selecting a document to delete SBW records
Alerts
Event Manager
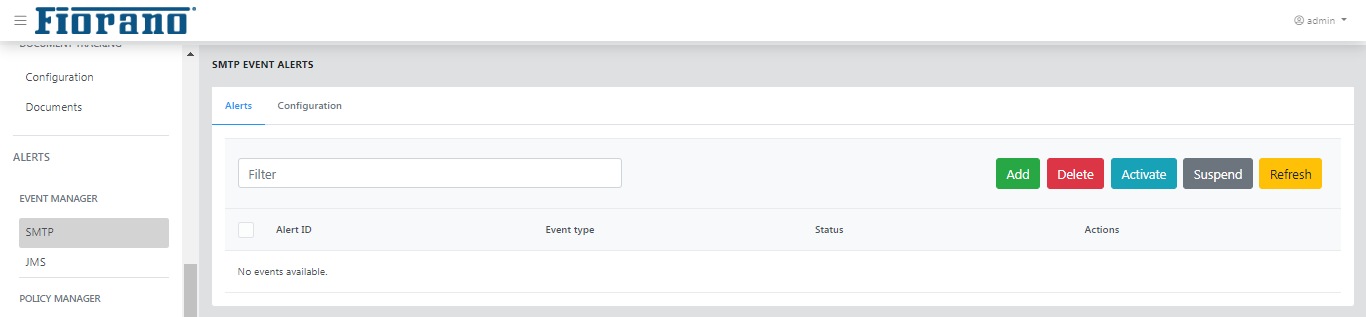
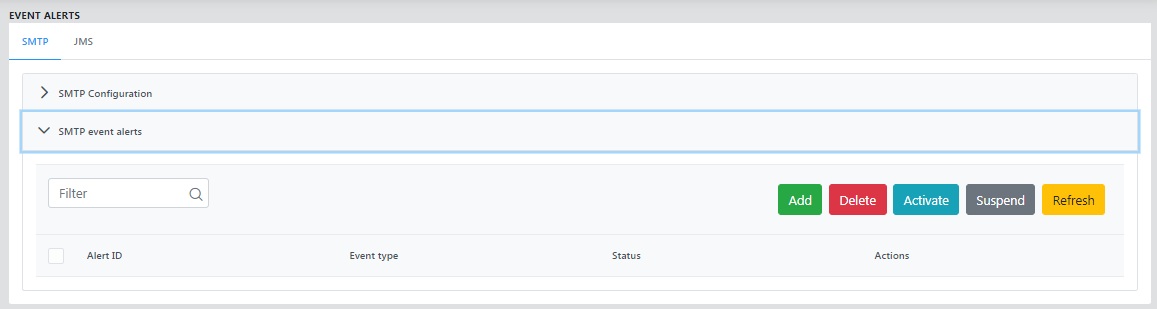
SMTP
SMTP event alerts can be added and server settings can be changed from this page.
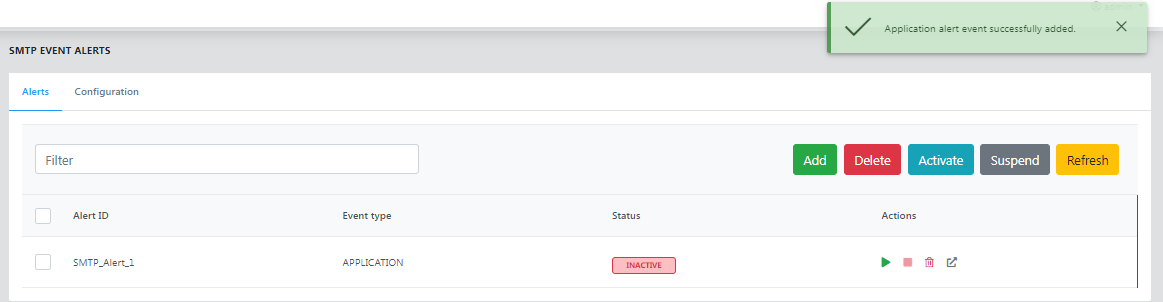
Alerts
This tab allows to add new alerts, and to edit, activate, suspend and also to delete an existing alert. All alerts that are added will be listed here.
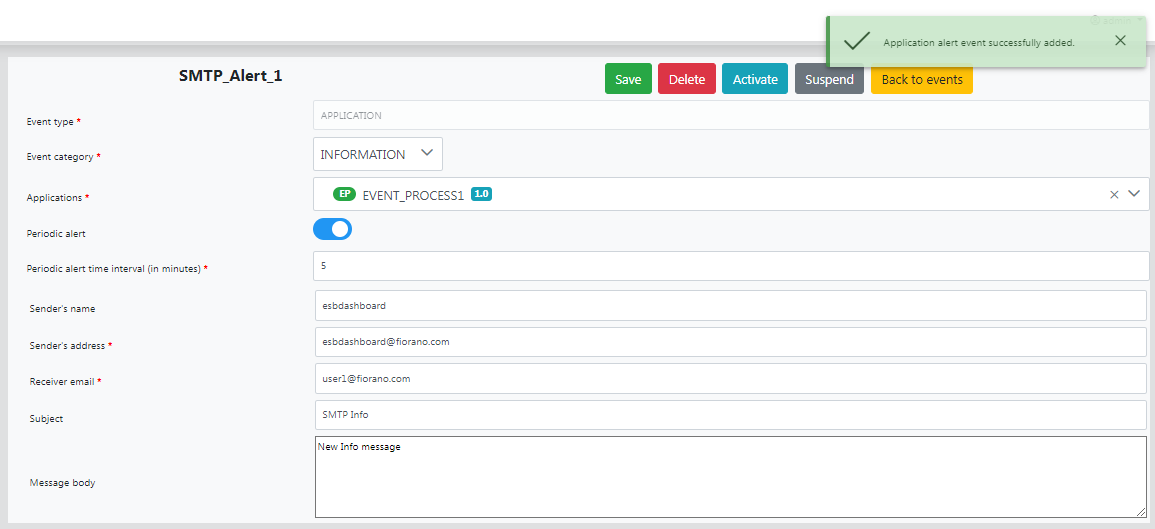
Adding an alert
To add an alert, click the Add button.
Choose the Event Type and Event Category from the drop-down list and enter the email ID of the recipient in Receiver email field.
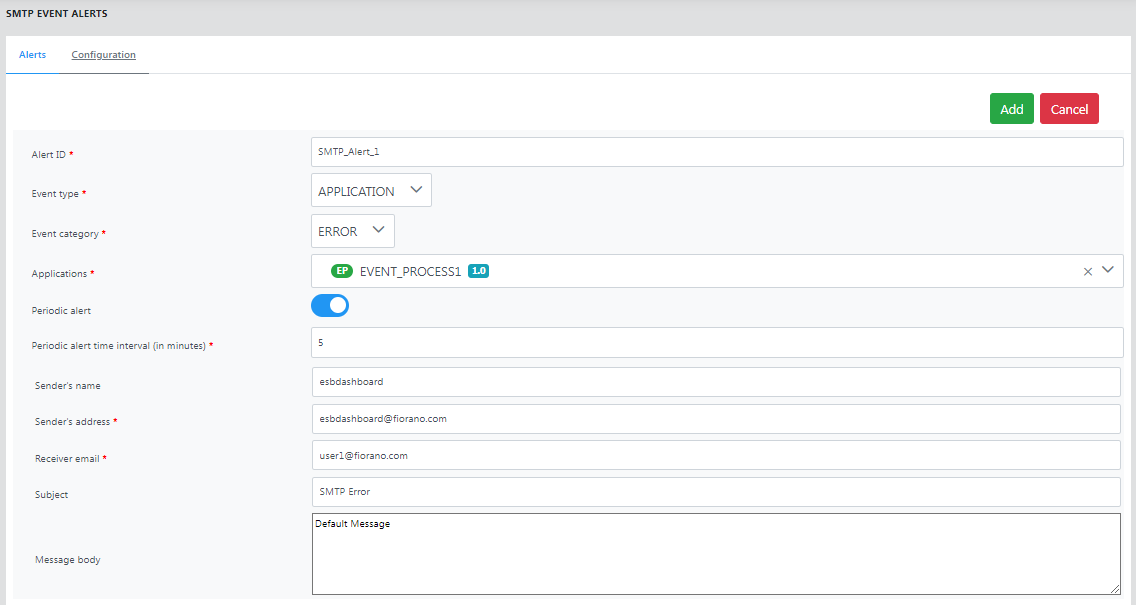
Figure 21: Configure SMTP Alert dialog box- Click the Add button to save the event.
To activate the alert, click the Activate
 icon.
icon.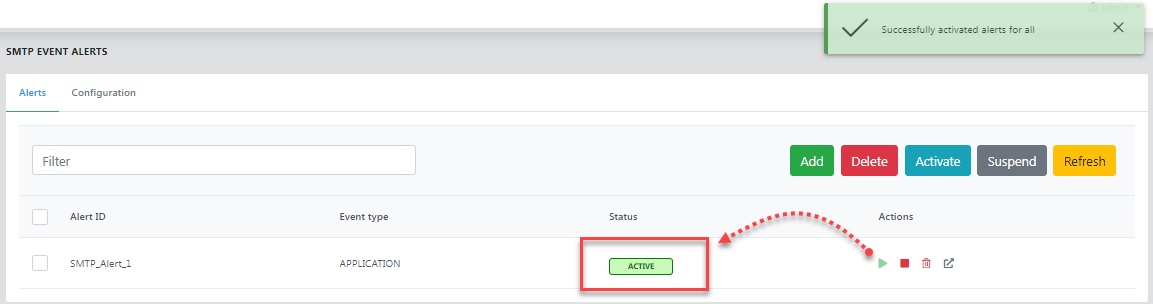
Editing an alert
- Click the Suspend
 icon to inactivate the alert, because an active alert cannot be edited.
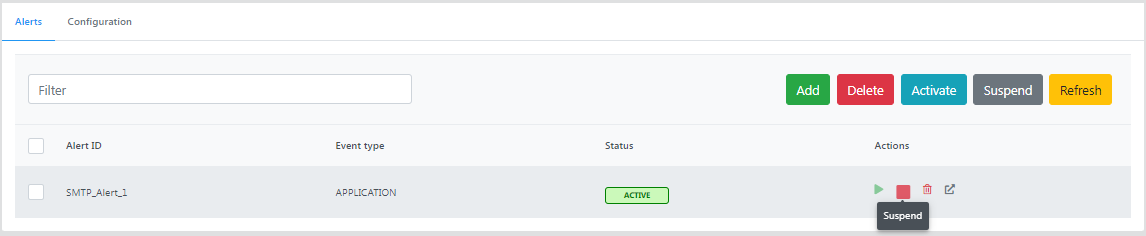
Click the Details icon.
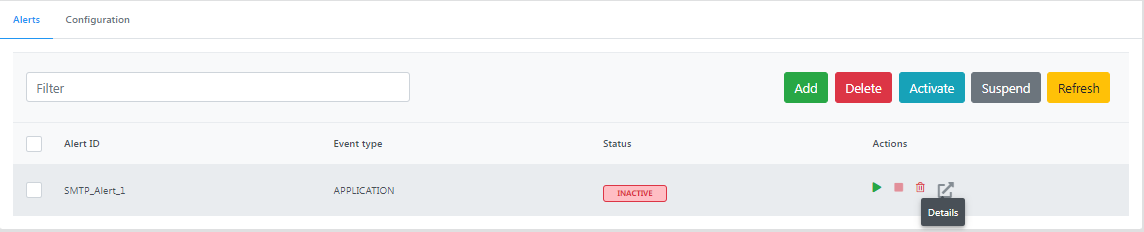
- Make the changes and click Save.
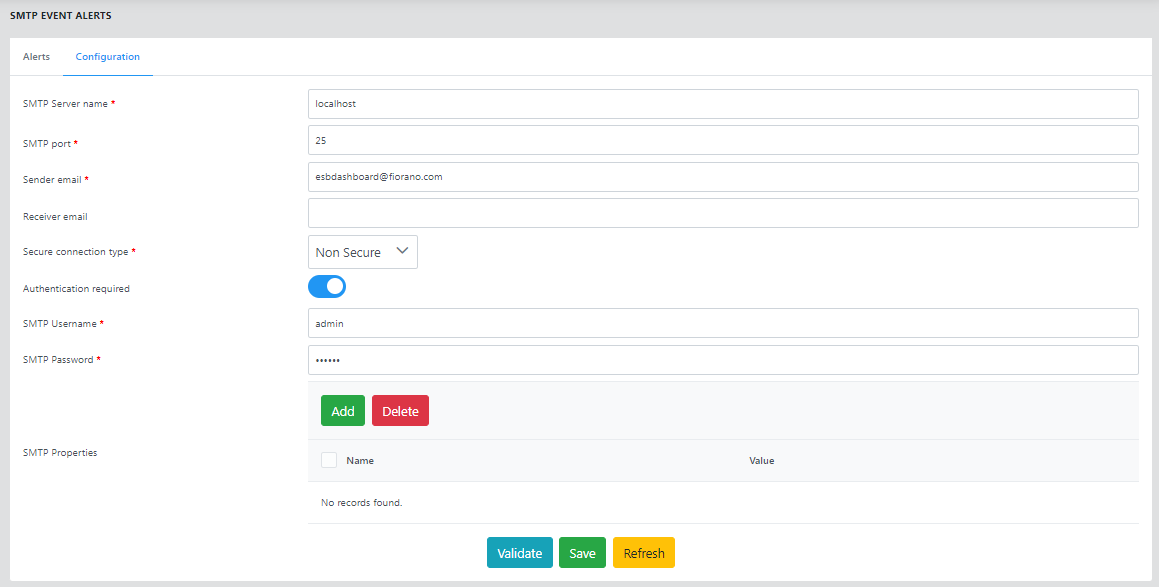
Configuration
You can change the configuration of the mail server settings in the Configure tab. This page also provides an option to specify usernames and passwords in case the mail server requires authentication of these in order to send e-mails. Enable the Authentication required option to provide credentials.
Provide the server details, click Validate to ensure that the connection is established, and click Save to apply the settings.
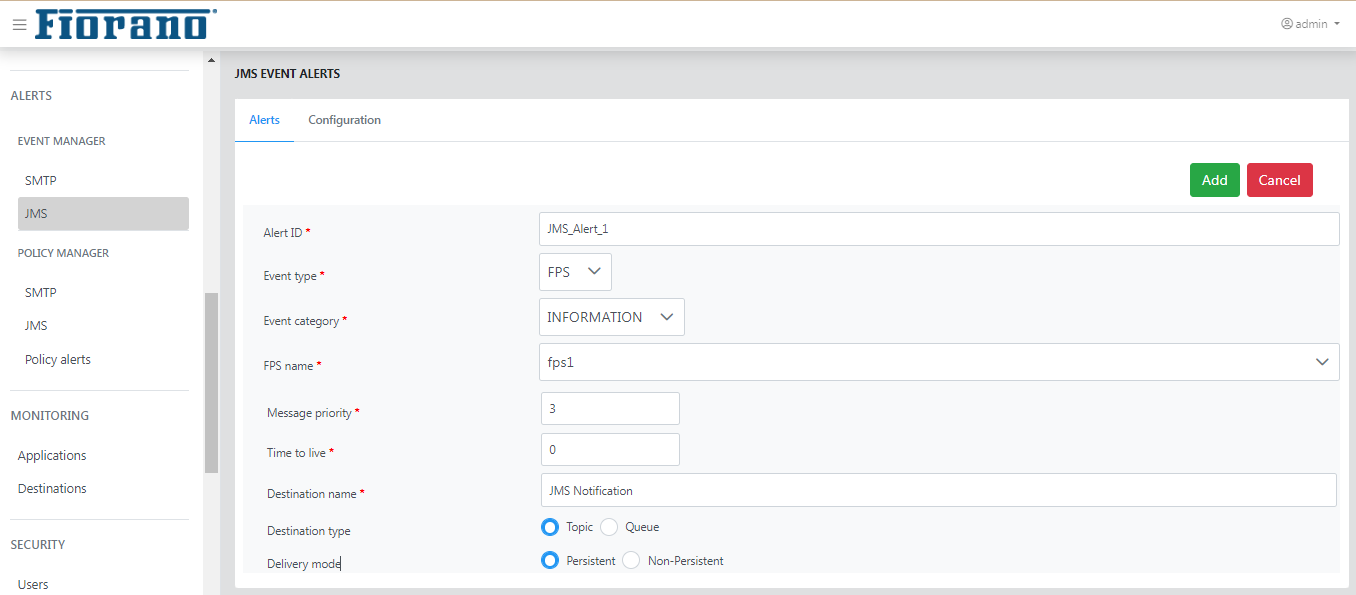
JMS
Alerts
Steps to add and manage a JMS alerts is same as illustrated in the JMS section under the Event Manager section.
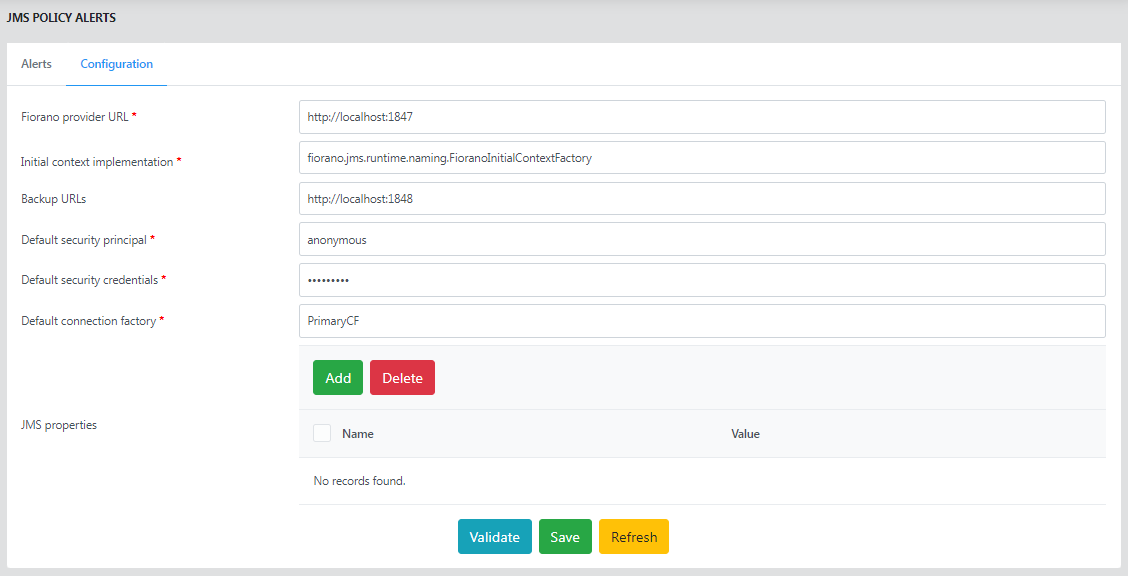
Configuration
Configure the JMS server settings in the Configuration tab. This page also provides an option to specify security credentials in case the JMS server requires authentication.
Policy Manager
Alerts are a combination of a message and a transport for delivering that message. A message could be in different formats such as plain text, XML, etc and transports could be any of the supported ones. Alerts created can be reused across different policies.
SMTP
JMS
Policy Alerts
This tab shows all the policies that are present in the Fiorano Network. This tab allows you to add the following types of policies, edit or delete an existing policy, activate or suspend existing policies.
- Backlog
- Low Disk
- Server Low Memory
- Component Low Memory
Monitoring
The monitoring section helps you to track Applications and destinations in the Fiorano Network. This section helps to monitor the performance of services by enabling monitoring in the respective component CPS.
The Monitoring tab has the following sections:
- Applications
- Destinations
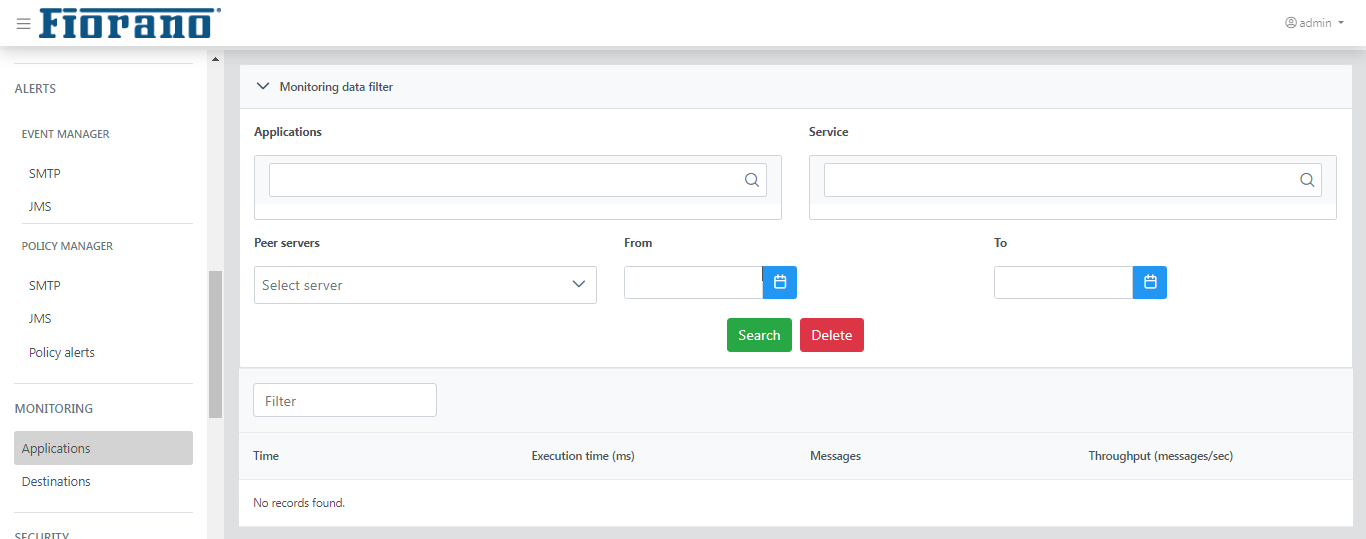
Applications
This view shows the performance based on messages sent by components in data form. Select the components for which monitoring data should be displayed for the selected period to see the performance. The details such as Time, Applications, Service, Peer, Execution time, Messages, and Throughput will be displayed.
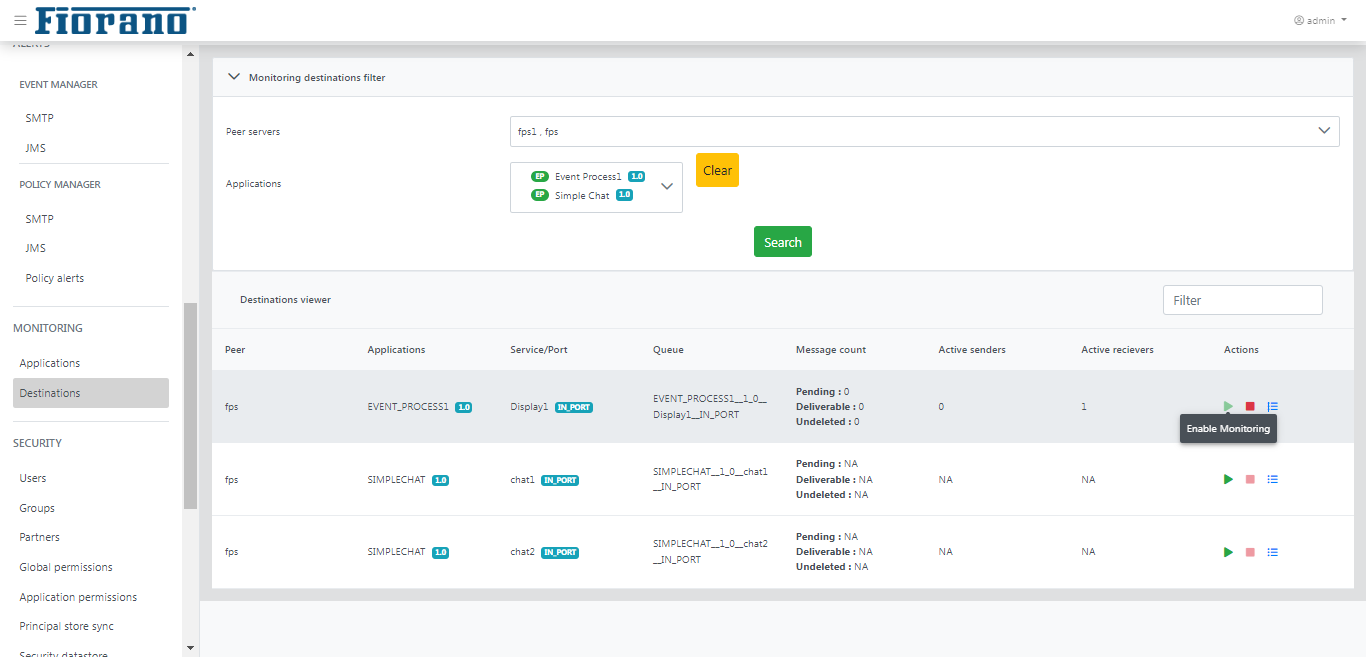
Destinations
This view allows the user to monitor Peer server name, Applications, Service/Port, Queue, Message count, Active senders, and Active receivers for the queues of applications that are running.
Select the Peer Server and applications for which logs need to be monitored and click the Search button to see the results under the Destinations viewer section.
Click the Play icon under the Actions column to start monitoring queues of the selected Application.
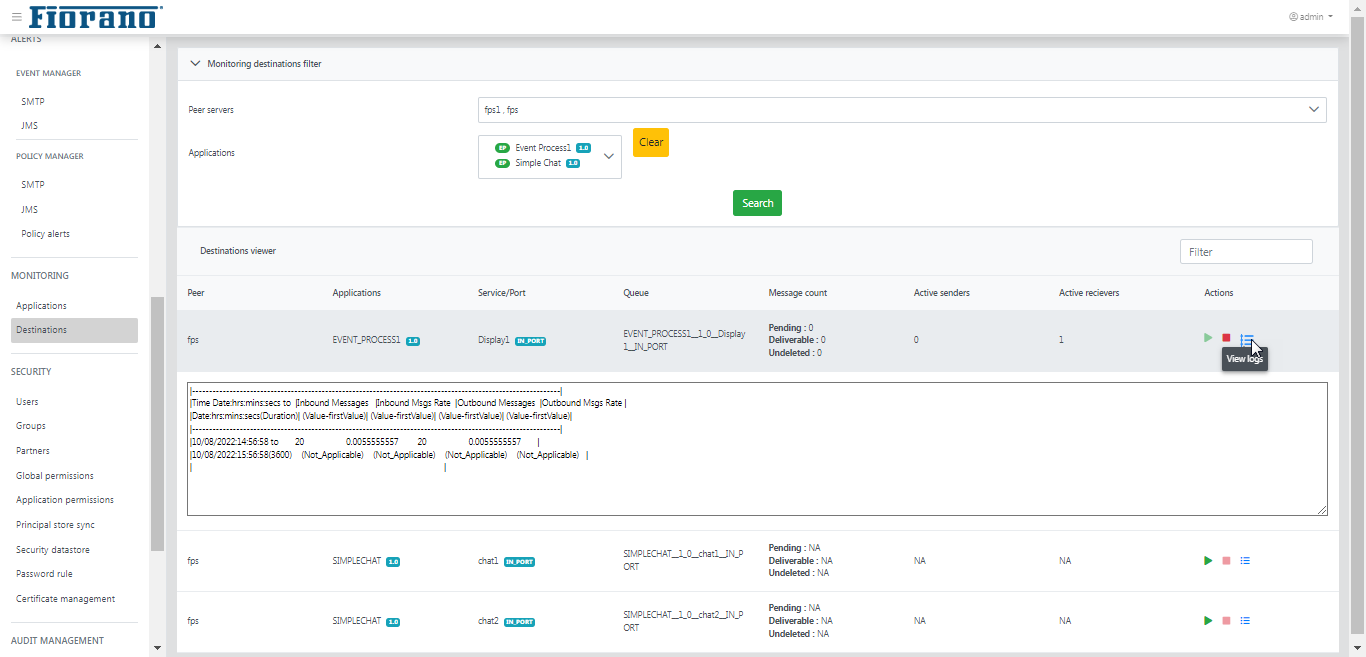
Viewing Message Logs
Click the Logs icon under the Actions column to view logs for monitoring the respective queue.
Security
Security section gives the security actions that can be performed in the Fiorano Network. These include adding/editing users, groups, application-level or group-level permissions, and validation or strengthen rules for passwords. These also include the principal store synchronization.
The Security tab has seven sections:
- Users
- Groups
- Partners
- Global Permissions
- Application Permissions
- Principal Store Sync
- Security Datastore
- Password Rule
- Certificate Management
Users
This tab shows users presently registered in the Fiorano network. The actions that can be undertaken in this tab include creating new users, deleting an existing user, or changing as well as encrypting a password for an existing user.
- Click the Add user button to add a new user and click the Delete icon present in the corresponding user row to delete that user.
- Click the Encrypt Password button to encrypt a password and click the Edit icon present in the corresponding user row to delete that user.
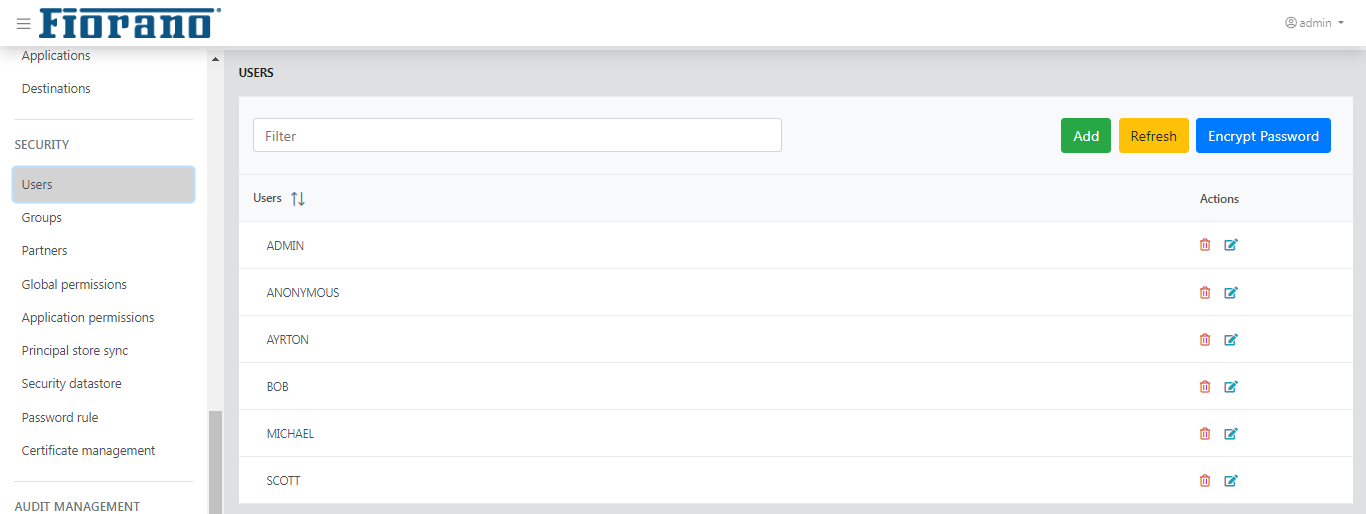
Figure 42: Users
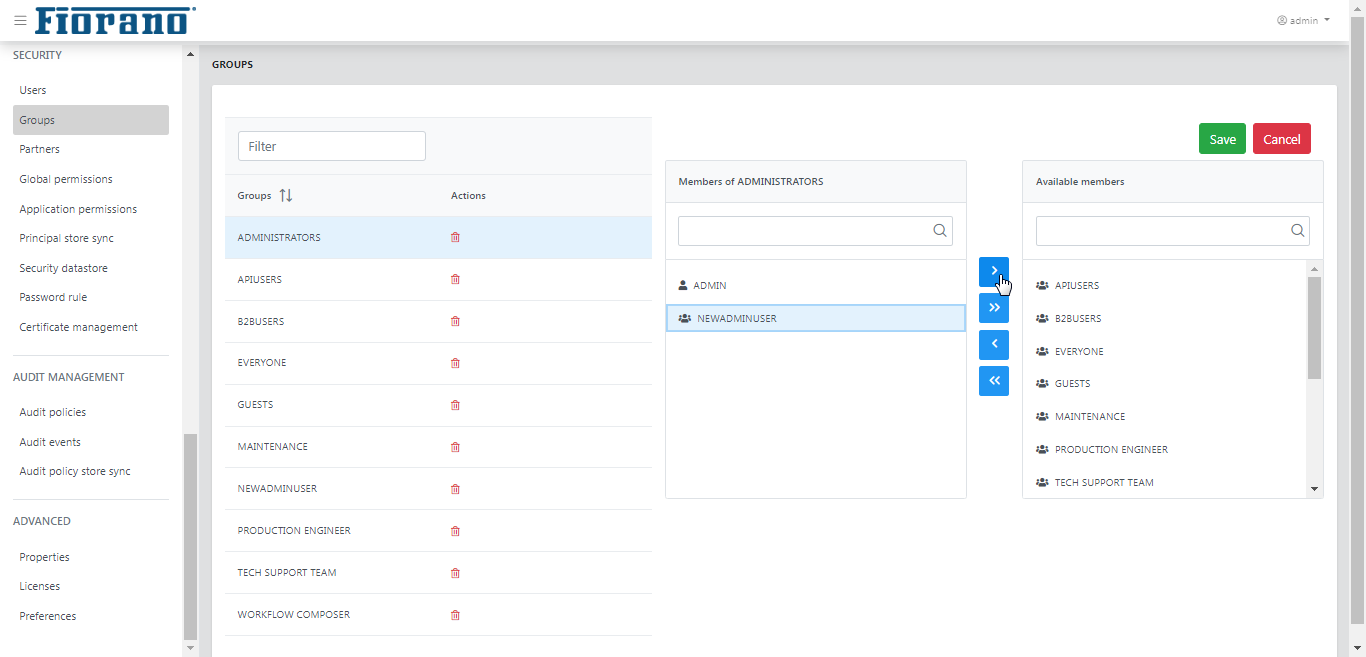
Groups
This tab shows the groups registered in the Fiorano network. Groups allow grouping users together and applying actions on them together. The actions that can be undertaken in this tab include creating new groups, deleting/editing an existing group.
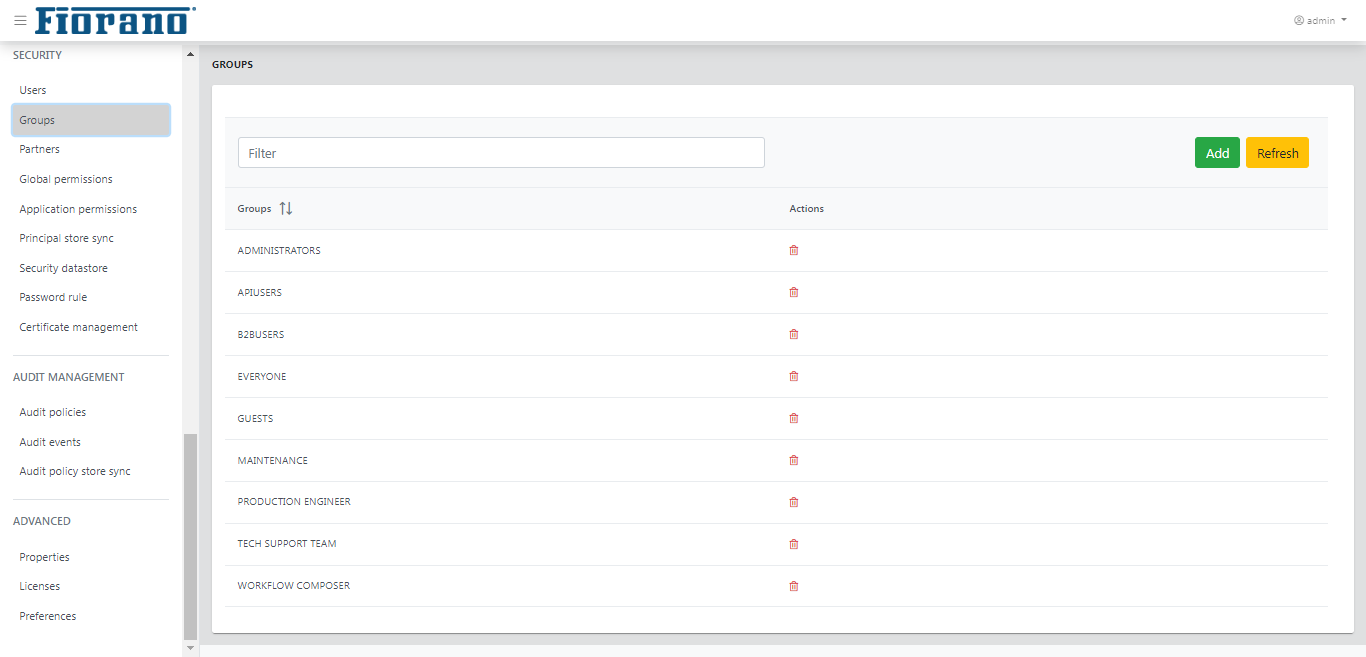
Click a group name to add/remove members. Select the user name and click the move button accordingly to add/remove.
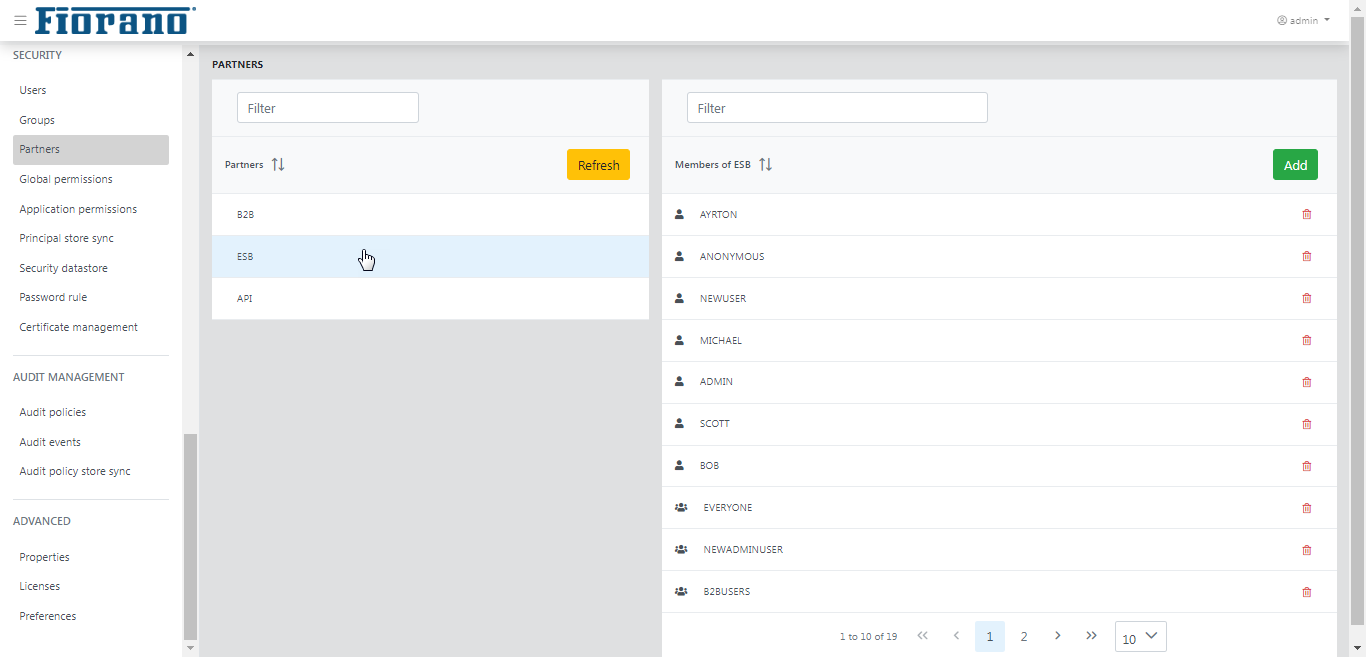
Partners
Partners help to create a collaboration of users and groups with other partners.
Click the partner node to see the list of members on the right-side panel. The panel on the right side allows adding as well as deleting its members who can be a user, group, or partner.
Global Permissions
This tab shows the global permissions that are currently available in the Fiorano network. This tab allows you to edit or specify the users for whom these permissions will be applicable.
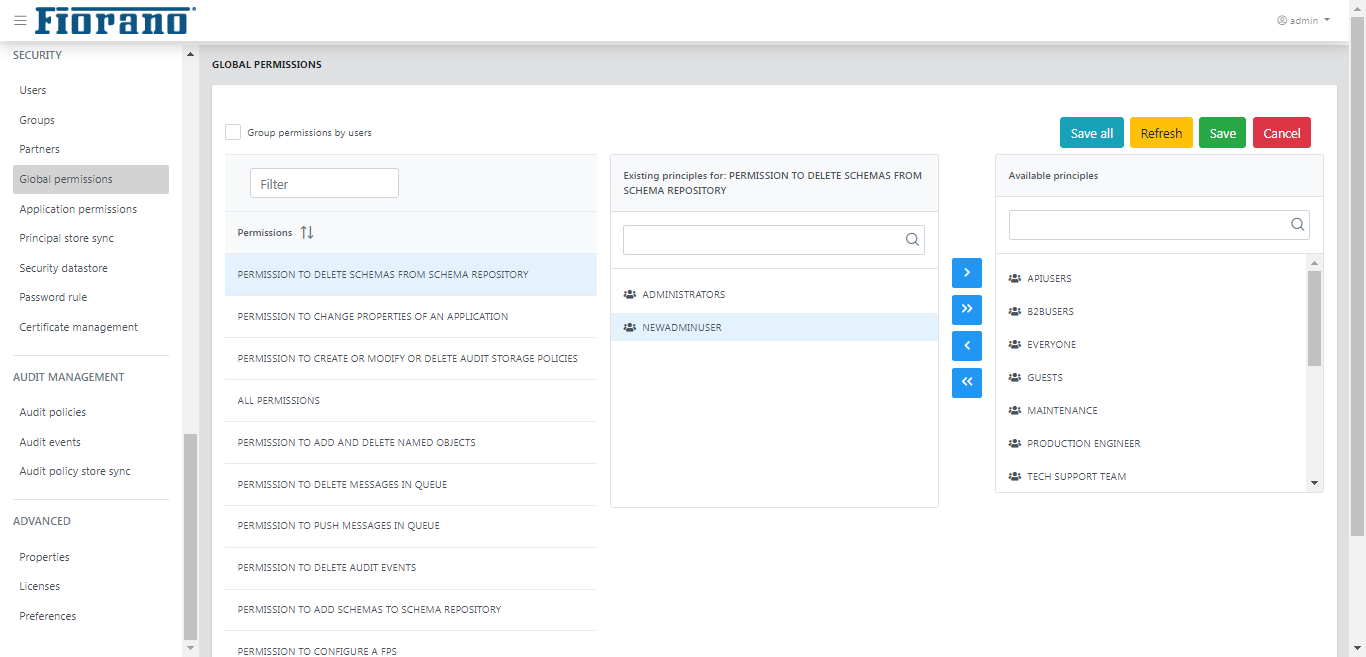
Figure 44: Global Permissions
Application Permissions
This tab shows the application permissions that are available in the Fiorano network. This tab allows to edit the application permissions for a user.
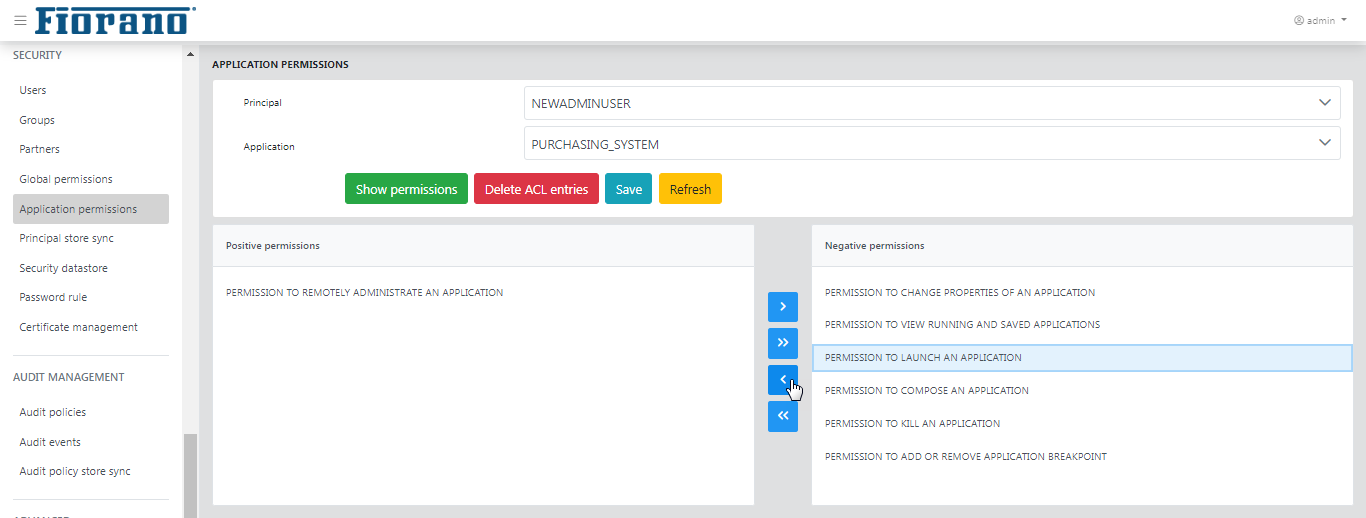
Figure 45: Application Permissions
Principal Store Sync
This tab shows the principal store synchronization status for the connected peers. This also allows you to synchronize the store for a peer.
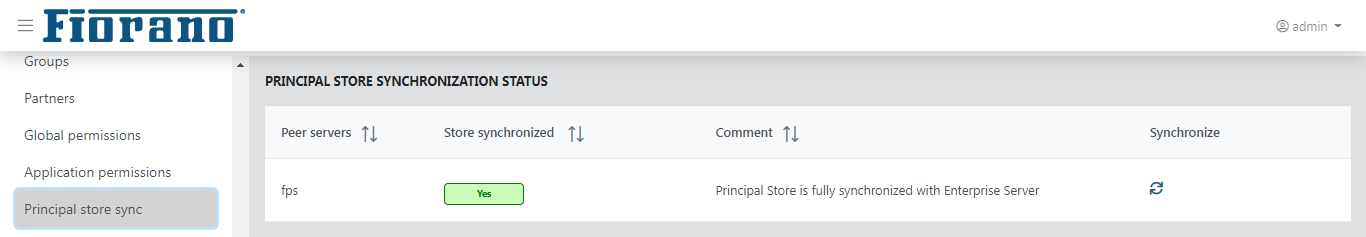
Figure 46: Principal Store Sync
Security Datastore
This tab shows the Security Datastore of the Enterprise Network. It also allows the authorized user to reset the entire Security Datastore viz. the Principals and the ACLs to system default.
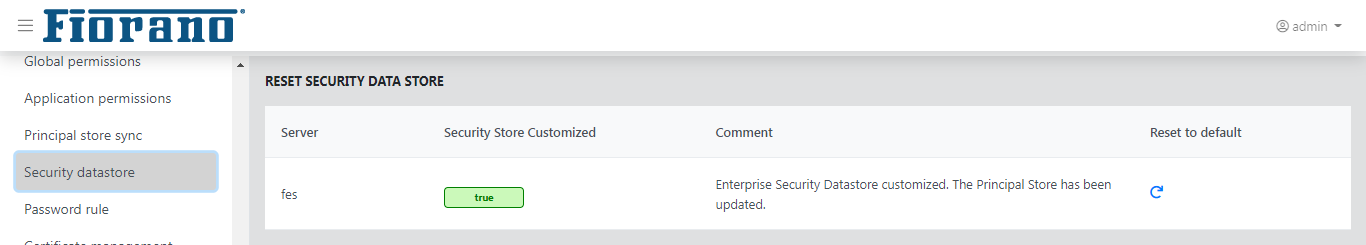
Figure 47: Security Datastore Reset
Password Rules
This tab shows the validation and strength rules that are used for matching the passwords or determining their strengths. This tab allows to add new rules or remove an existing one. By default, Strength rules are available but no validation rules are provided.
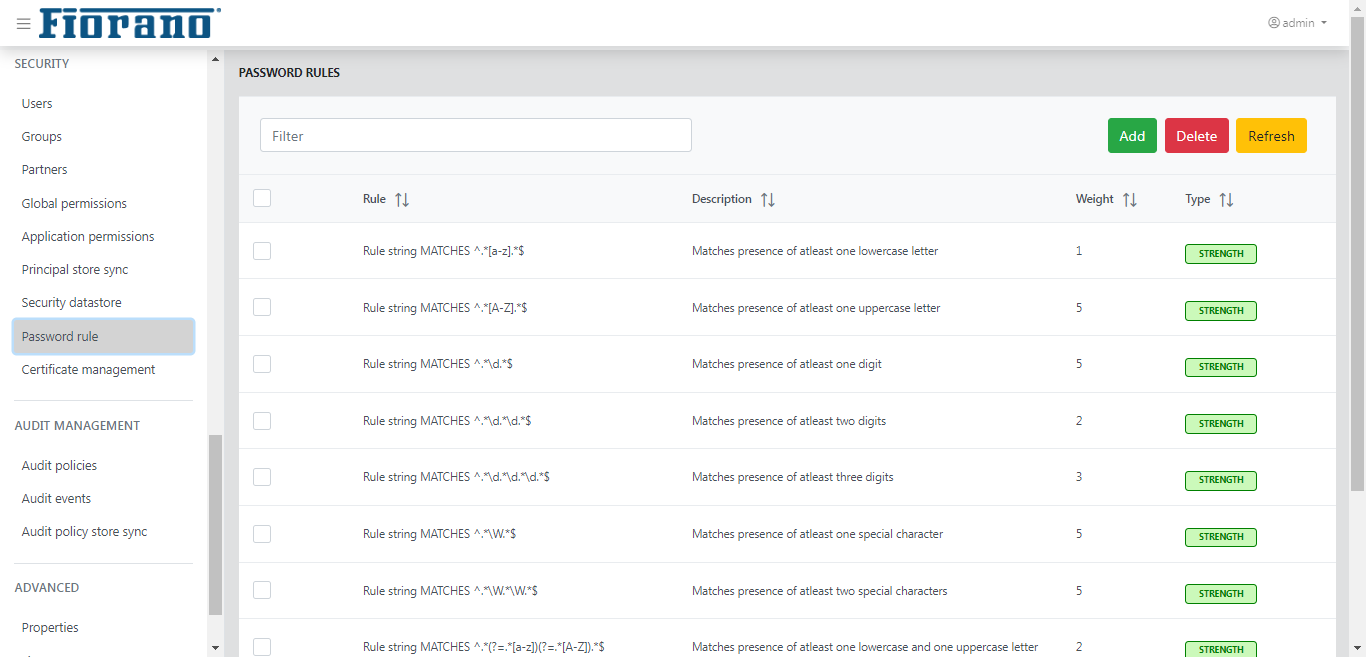
Click the Add rule button to add a new rule with Rule type Validation/Strength and Rule class Length/Match.

Figure 48: Password Rules
Certificate Management
This feature shows the list of keys of the server's trust store. This also allows to add or remove keys to server's trust store. Click the Add key button to add a key.
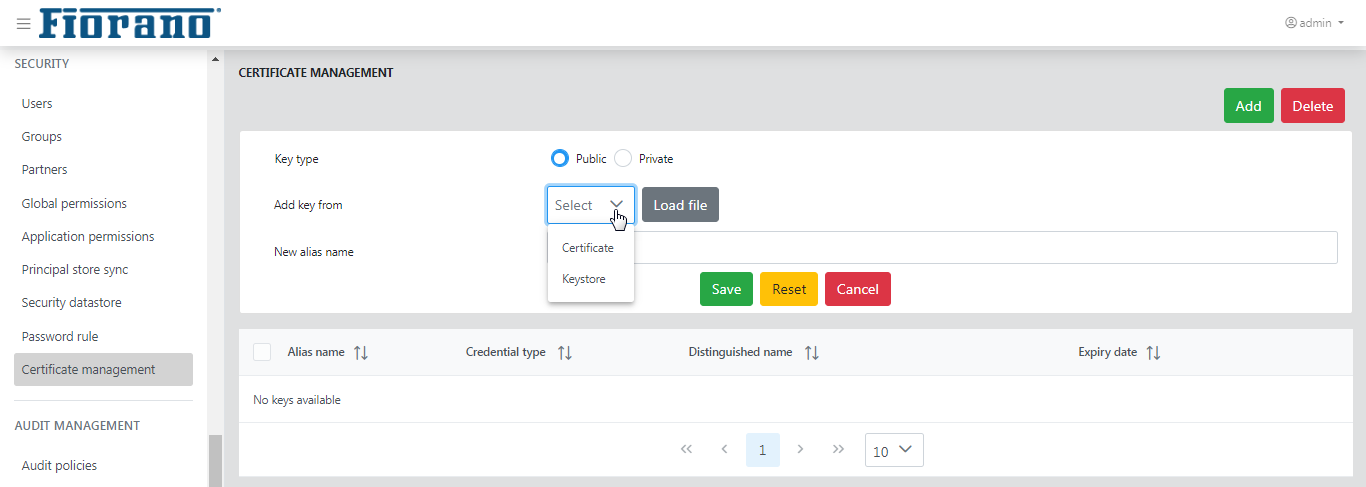
Figure 49: Certificate Management options
To add a key,
Select Private or Public.
In the Add key from drop-down, select "keystore" or "certificate" and click the Load File button to provide further details.
In the Add keystore File dialog box, click the Choose button to add the keystore file and provide the keystore password to load keys from the keystore, and click Upload.
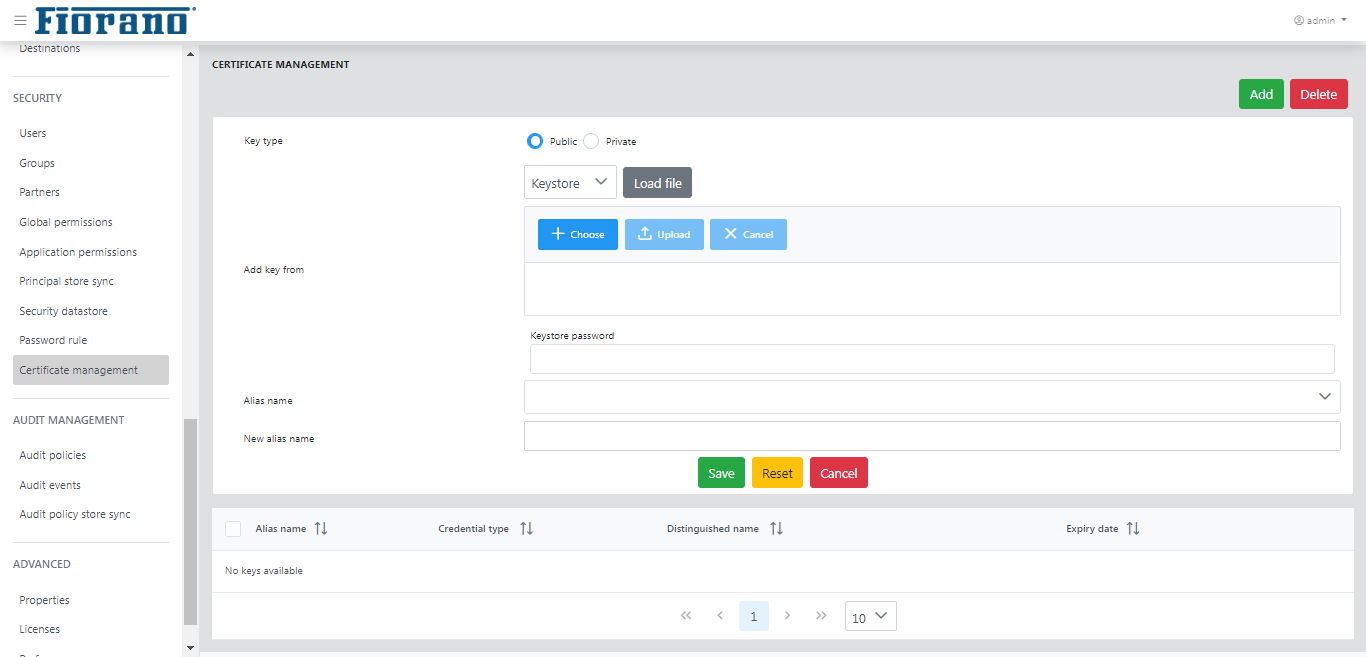
- Select the key from Alias Name drop-down and click the Save button to apply the changes. After successful save, keys get displayed in the key under List of Keys tab.
- To remove keys from trust store, click the Delete button.
Audit Management
Audit Management section in web console allows defining audit policies and searching for audit events as per requirement. This section has been divided into 3 sub-sections.
- Policies
- Events
- Audit policy store sync
Audit Policies
In this view, you can view/edit available audit policies. These policies define the actions that will be audited by the system. In a fresh installation, all policies are in passive state, meaning none of the action is audited. You can selectively enable the actions that they want to audit.
The Show only active policy option helps to filter active policies.
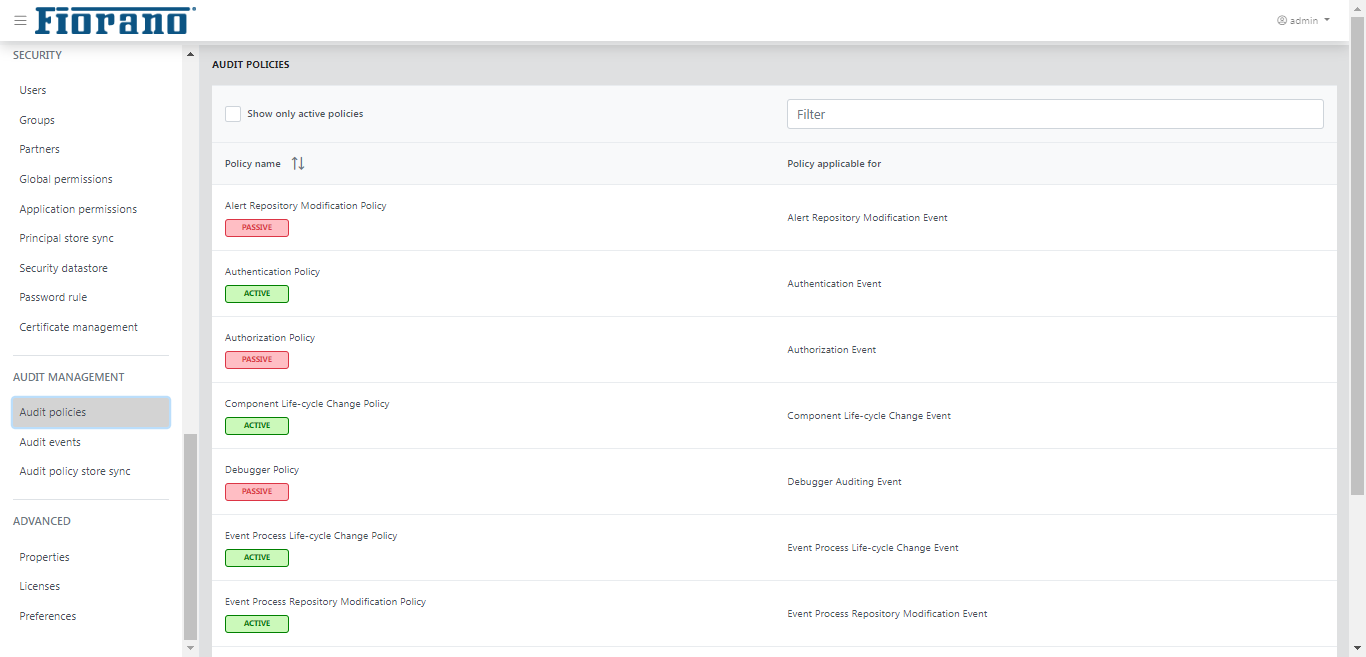
Click a policy name to set the policy with status and category accordingly.
- Event status
- Success
- Failure
- Event category
- Information
- Error
- Warning
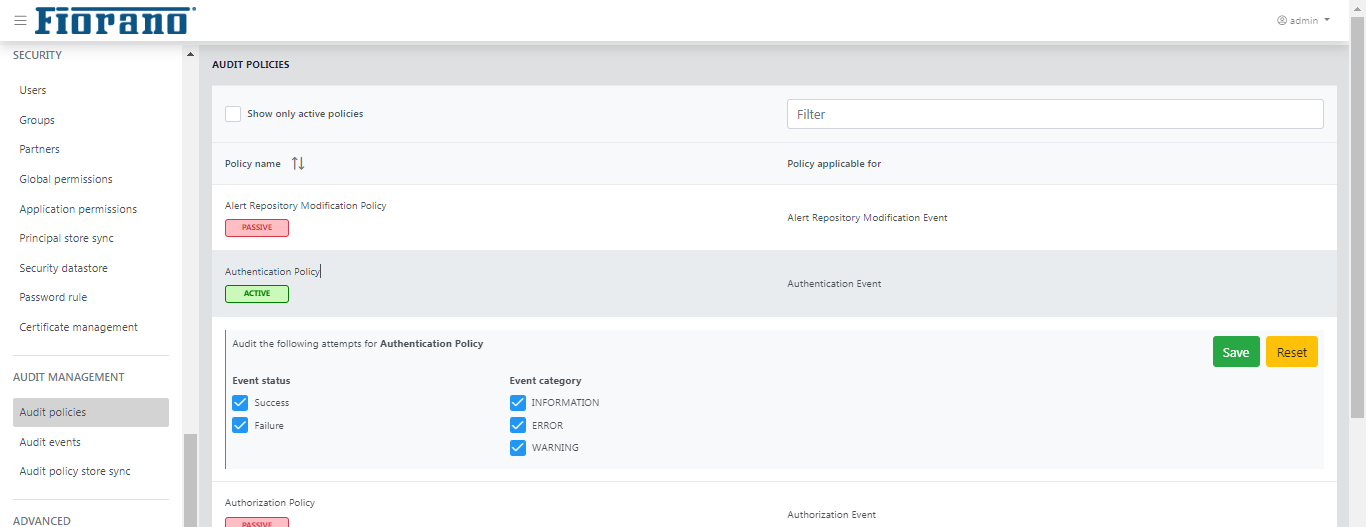
Figure 54: Policies
Audit Events
This view shows audit events based on the specified search criteria. A comprehensive list of audit event filters is available to refine the audit events as per requirement. This view also allows saving search preferences for later use, thus avoiding the painful task of creating audit filters each time you need to search. Below is a snapshot of Audit Events page rendered after searching for certain audit events.
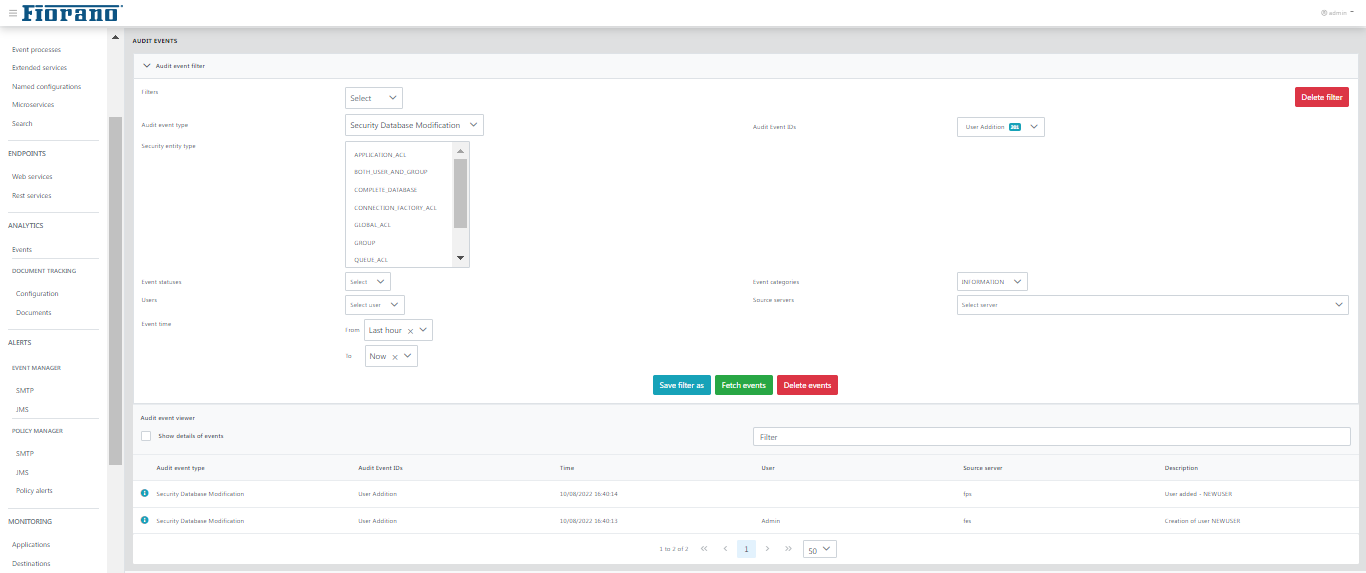
Figure 55: Event Viewer
Audit Policy Store Synchronization
This view shows the result of synchronization of audit policy store operation. A synchronized audit policy store means that the same audit policies (as in Enterprise Server) are active in peer servers as well.
If stores are not synchronized, the status field will display a cross mark in place of a tick mark and the reason for which the synchronization is not achieved will be displayed under the Comment column.
Audit policies can be force re-synchronized with a peer server by clicking the refresh icon under the Actions column.
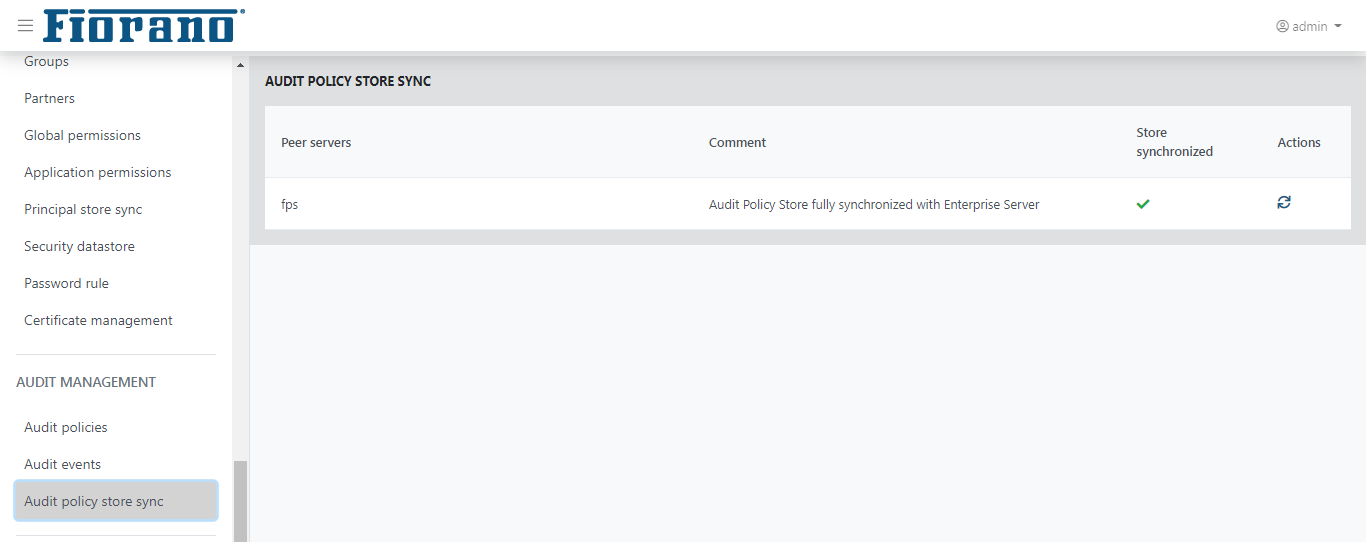
Figure 56: Audit Policy Store Synchronization
Advanced
Properties
This tab allows changing the values of frequently used server properties under the following sections:
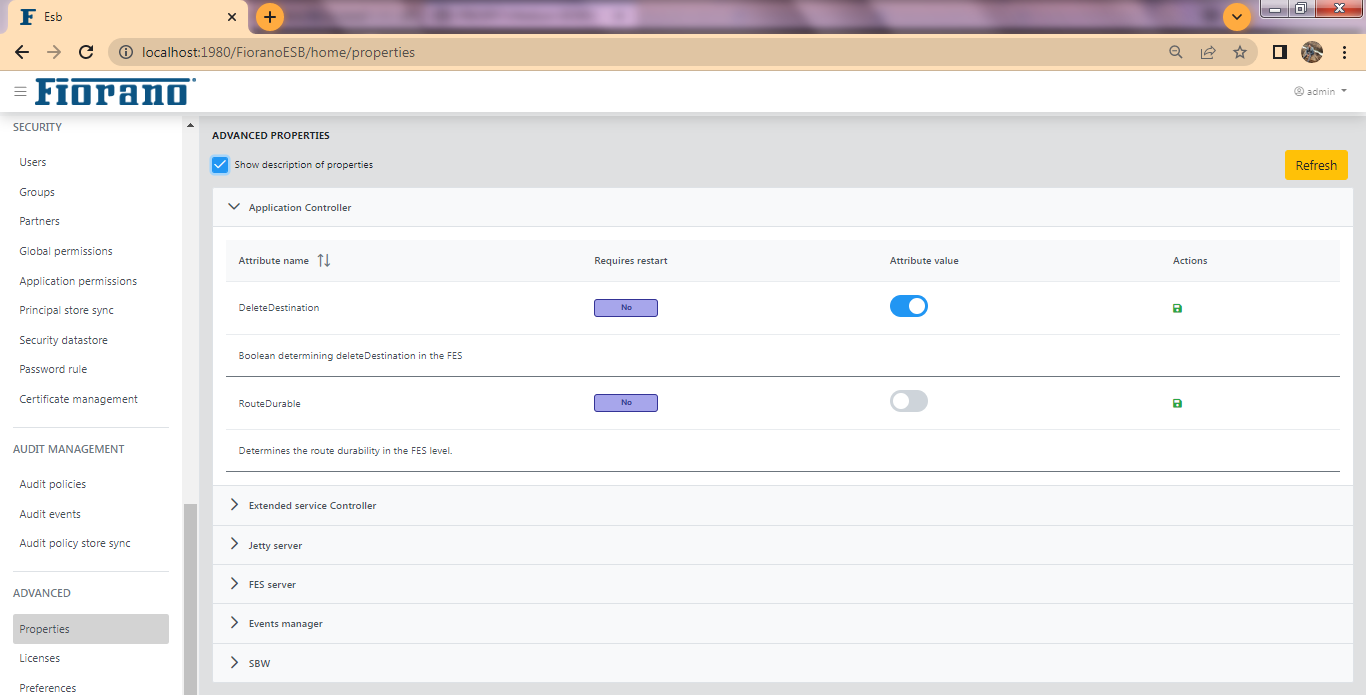
Click the Save icon under the Actions column to save a changed configuration and then click the Refresh button to keep the change into effect.
Attributes that can be changed are as follows
Application Controller
See the image above.
- Delete Destination: Boolean determining deleteDestination in the FES
- Route Durable: Determines the route durability in the FES level.
Extended Service Controller
- Delete Destination: Boolean determining deleteDestination in the FES
- Route Durable: Determines the route durability in the FES level.

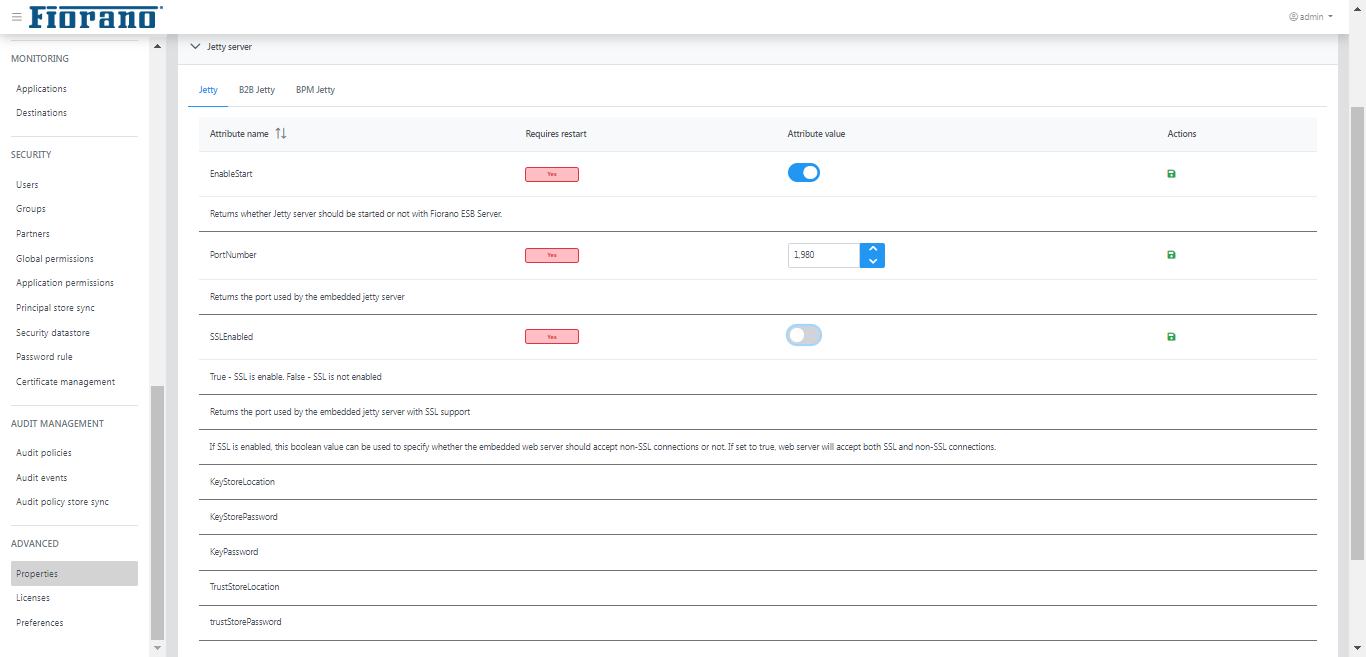
Jetty Server
Jetty, B2B and BPM Jetty under it has the following options:
- EnableStart: Returns whether Jetty server should be started or not with Fiorano ESB Server.
- PortNumber: Returns the port used by the embedded jetty server
- DefaultConnectorEnabled: If SSL is enabled, this boolean value can be used to specify whether the embedded web server should accept non-SSL connections or not. If set to true, web server will accept both SSL and non-SSL connections.
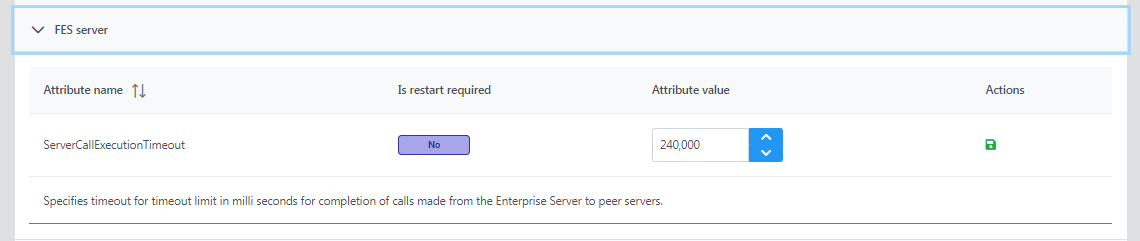
FES Server
ServerCallExecutionTimeout: Specifies timeout for timeout limit in milliseconds for completion of calls made from the Enterprise Server to peer servers.
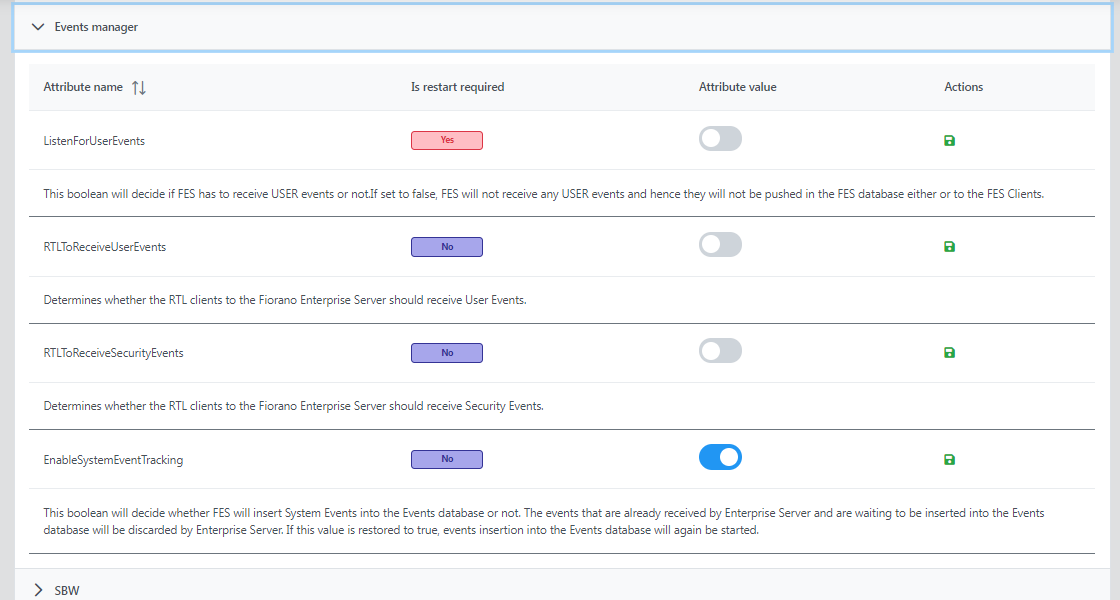
Events Manager
- ListenForUserEvents: This boolean will decide if FES has to receive USER events or not.If set to false, FES will not receive any USER events and hence they will not be pushed in the FES database either or to the FES Clients.
- RTLToReceiveUserEvents: Determines whether the RTL clients to the Fiorano Enterprise Server should receive User Events.
- RTLToReceiveSecurityEvents: Determines whether the RTL clients to the Fiorano Enterprise Server should receive Security Events.
- EnableSystemEventTracking: This boolean will decide whether FES will insert System Events into the Events database or not. The events that are already received by Enterprise Server and are waiting to be inserted into the Events database will be discarded by Enterprise Server. If this value is restored to true, events insertion into the Events database will again be started.
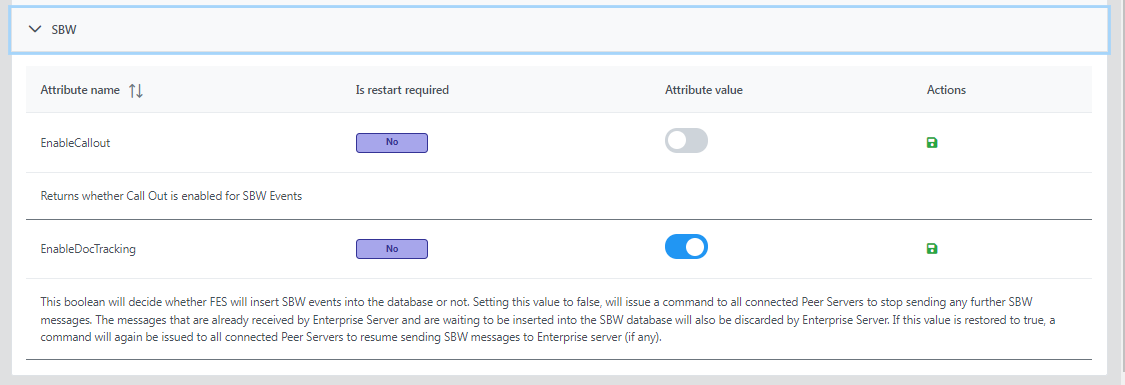
SBW
- EnableCallout: Returns whether Call Out is enabled for SBW Events
- EnableDocTracking: This boolean will decide whether FES will insert SBW events into the database or not. Setting this value to false, will issue a command to all connected Peer Servers to stop sending any further SBW messages. The messages that are already received by Enterprise Server and are waiting to be inserted into the SBW database will also be discarded by Enterprise Server. If this value is restored to true, a command will again be issued to all connected Peer Servers to resume sending SBW messages to Enterprise server (if any).
Enabling Fiorano Web Console
The Fiorano Web Console can be enabled from Online as well as Offline mode.
Online mode
To enable Fiorano Web Console in online mode (server running):
- Login to Peer server via JMX(FPS-JMX)
- Navigate to Fiorano > etc > Jetty Server > JettyServer > config and set EnableStart property to 'yes'.
- Right-click on FPS-JMX and click Save Configurations option.
- Shut down both Peer and Enterprise servers.
Offline mode
To enable Fiorano Web Console in offline mode (server not running):
- Open profile in eStudio, browse to Fiorano > etc > Jetty Server > JettyServer > config and set EnableStart property to 'yes'.
- Save profile.
After editing profile (online or offline), perform the following actions:
Clear peer repository using the following command
- Restart the servers.
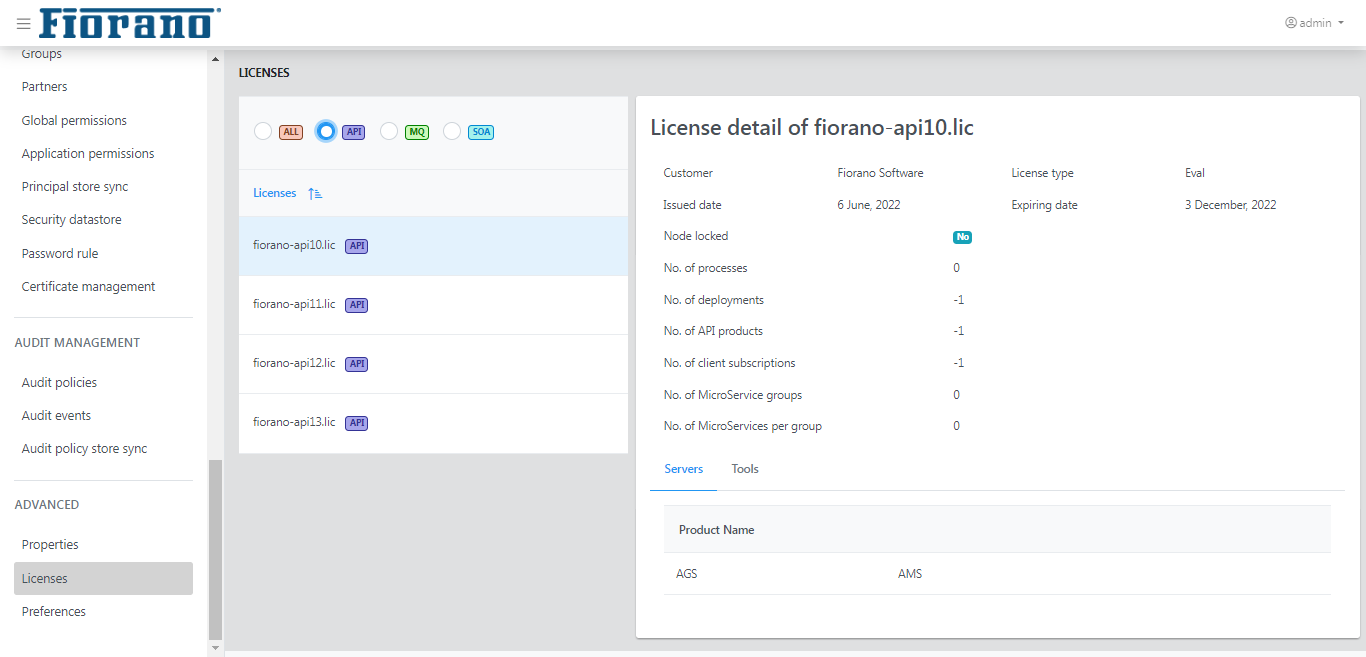
Licenses
This page lists the details of licenses that belongs to API, MQ, and SOA of all versions of Fiorano.
Select a license to view the details of a license.
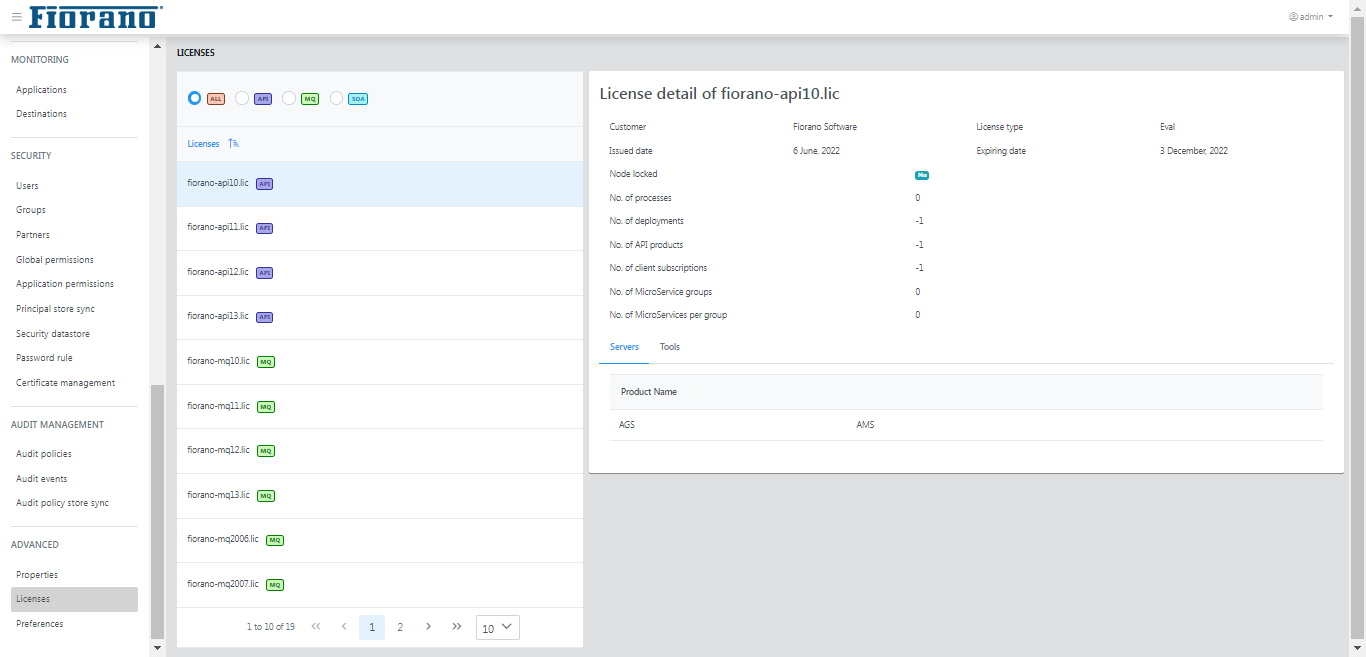
By default, all licenses appear on the page. It can be segregated based on whether it belongs to API, MQ, or SOA.
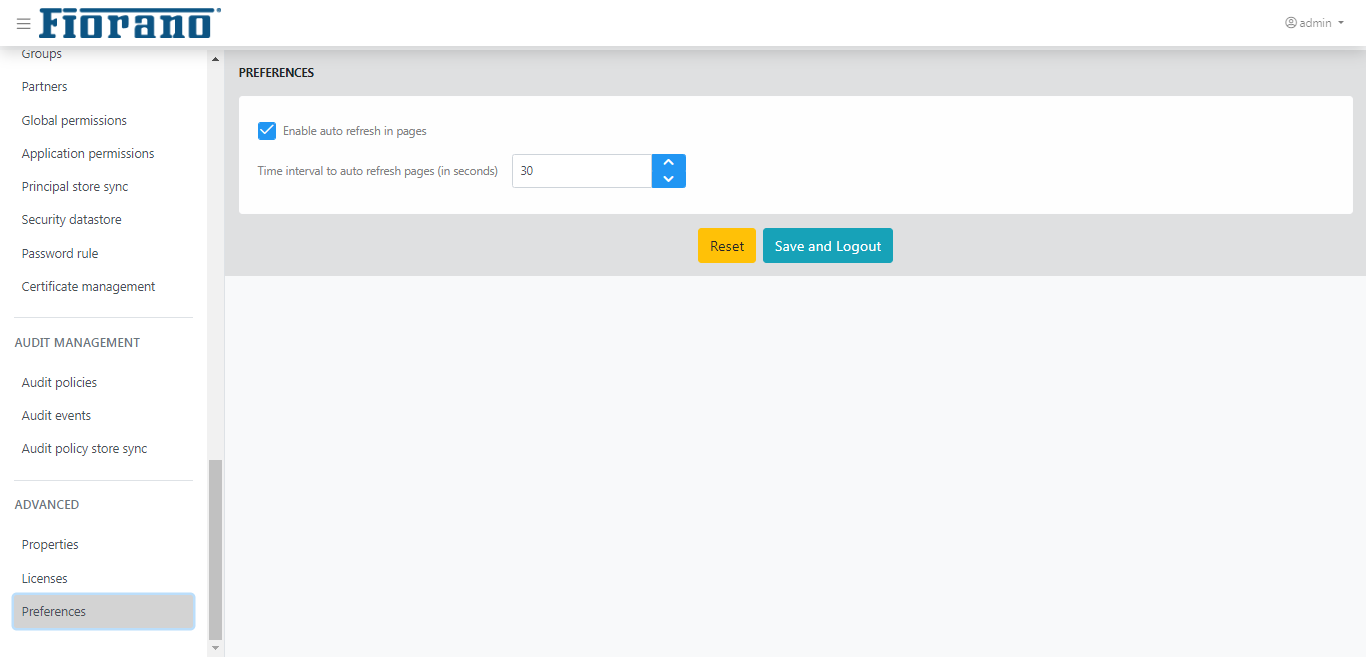
Preferences
The "Enable auto refresh in pages" property helps to refresh the Enterprise servers and Peer servers pages in the ESB dashboard at the interval of time specified in the "Time interval to auto refresh pages (in seconds)" text box.