What is Analytics ?
Analytics enable you to work with data collected from the requests coming into the API Projects. This section arranges the data received in a visual representation using graphs for better understanding and analysis.
It enables you to view the data in multiple chart representations, using various predefined metrics (Traffic, Average Proxy Processing Time, etc.) for a specified time period.
Why Analytics ?
Analytics data is collected with a very high degree of security and uses advanced tracking capabilities to provide precise data for a Near-Real-Time representation. It allows you to view the Moving Average Curve to understand the trend in usage of APIs, and also provides an option to investigate a specific part of the main representation using various entities/resources (project name, product name, context path, etc.).
You can use it to analyze the services provided by the APIs by understanding the total no of requests coming in, peak time for target URL access, errors faced etc. as these will help you to provide better service for your clients who are trying to access the target URLs and also help you decide on the upgrades needed to your systems for the same.
How does Analytics Work ?
Analytics panel provides you with a User Interface to analyze the performance and activity of the APIs being managed by the API Servers.
To analyze performance and activity details, navigate to the respective page through the Analytics - View Performance Metrics section.
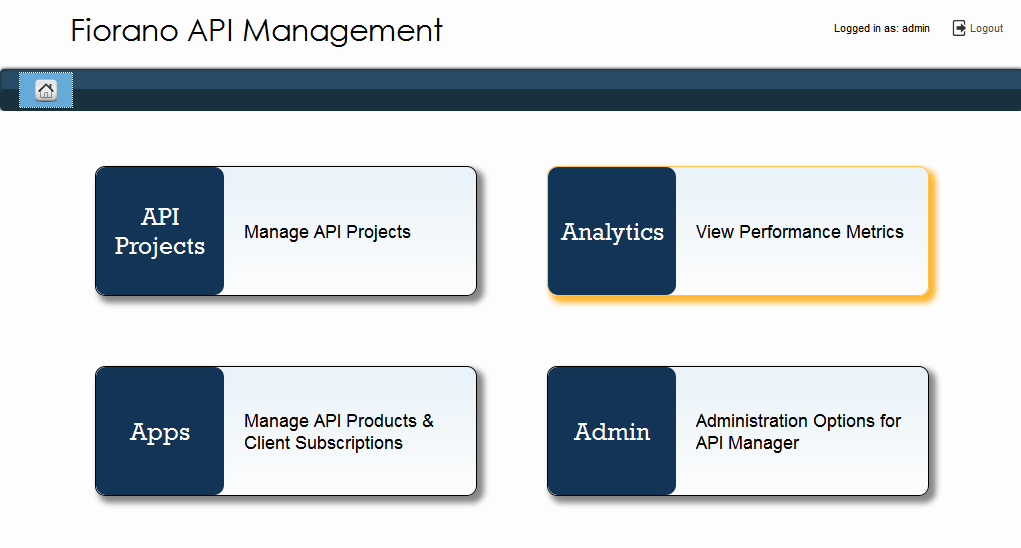
Figure 1: Fiorano API Management Dashboard with the Analytics prompt highlighted

Figure 2: Analytics landing page
Follow the below links to explore the options available in the Analytics section: