This option is used to analyze a specific cross section of graph. This is particularly useful in anlayzing any anomalies like peaks in traffic and drill down using various conditions.
To do this analysis, after selecting a criteria, you just need to select the required region by clicking the starting point of your choice and then the end point; this zooms the area that you chose.
For example, consider the graph that is generated using group by condition (Figure 3 in the 'group by' Conditions section). If you want to analyze data for a particular minute, say 16 minutes, select the area between 16:00 and 16:17 (as per the graph in consideration—Figure 3 as referred before) by following the steps below:
- In the graph, click the area which represents the starting of 16 minutes (16:00). The area will be marked by a vertical line.
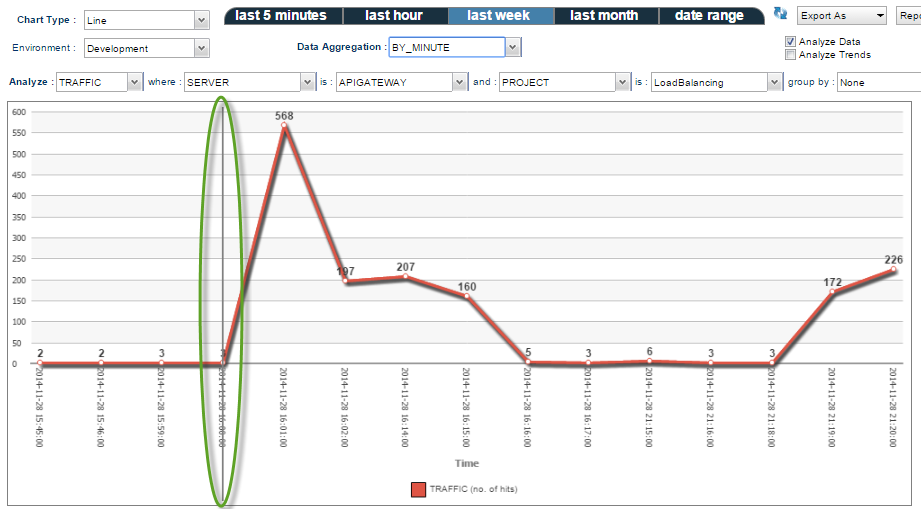
Figure 1: Analytics section with the starting point selected
- Now click the end point as required; click the area near the end of 16 minutes (16:17). You will get a zoomed form of the selected area of the graph.
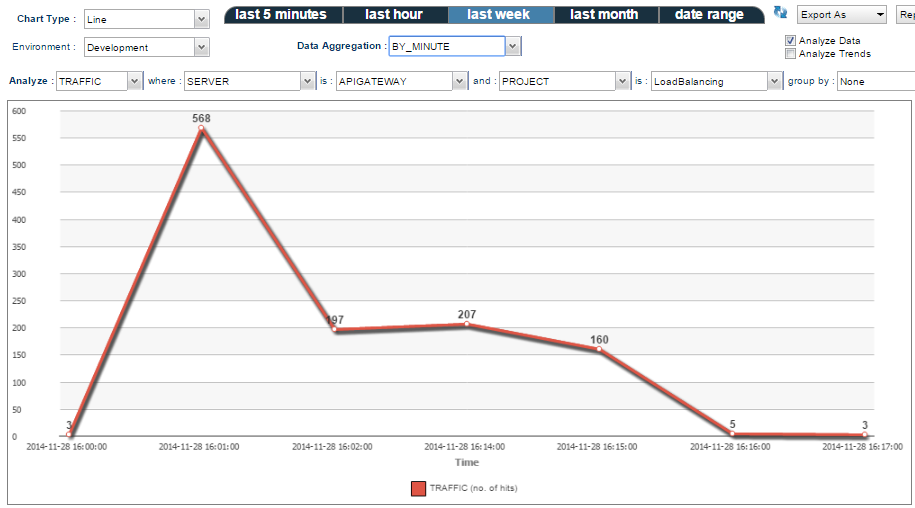
Figure 2: Graph for the selected area, holding data for start time of 16 minutes and its end time (16:00 to 16:17)
Refreshing Data
It is possible to drill down data based on multiple criteria as well. For example, it is possible to check for requests to a specific API from a particular developer resulting in a certain error.
The refresh button can be used to re-fetch data from the server and re-plot the main representational chart.
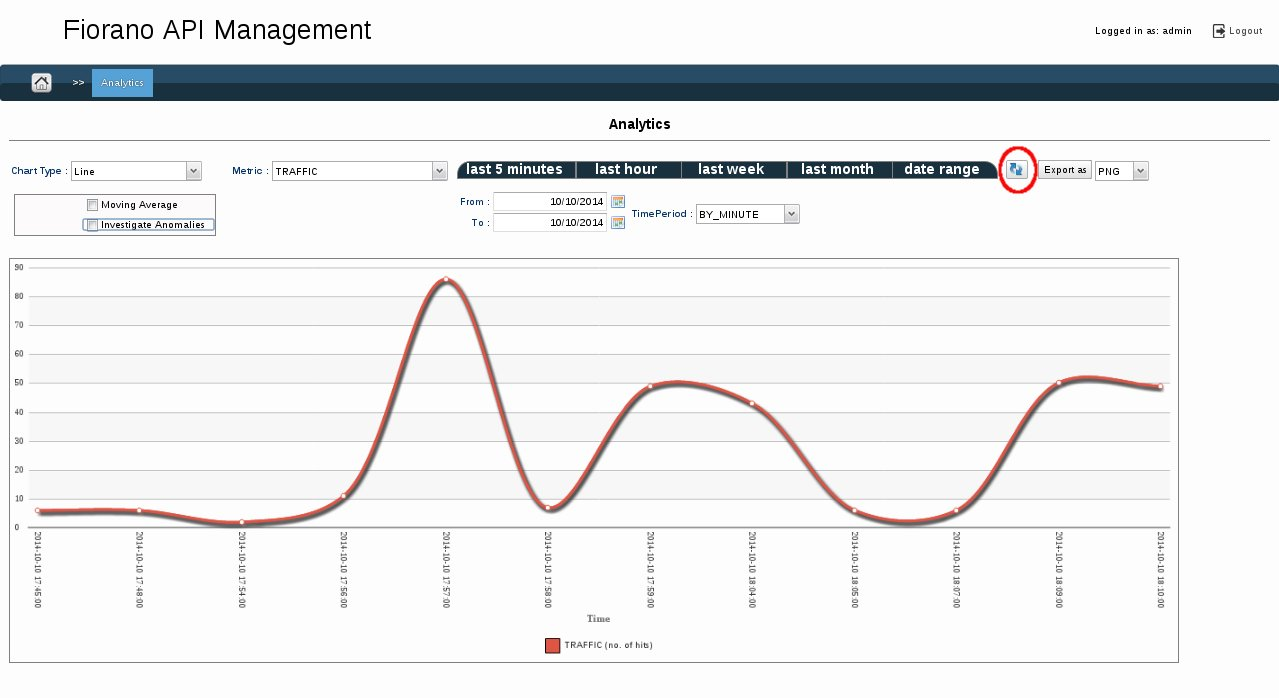
Figure 3: Analytics section with the refresh option highlighted