A User can get depth or pending message count of a queue from the apis available at queue level. A User can view the pending message using the administration connection or the existing JMX Apis. If a User wants to capture events when the depth of a queue crosses a certain level, the User can go through this section to understand how to configure the Server to receive 'depths' notification.
35.2.1 Configuring Through Configuration files
To configure 'depths' of a queue, the user needs to enable depth monitoring at the Server level.
To enable depth monitoring at the Server level.
- Open Configs.cfg file under the conf folder of the Server profile.
- Navigate to Queue Settings. Set DepthMonitoringEnabled to TRUE.
Once this flag is set to TRUE, depth monitoring is enabled at the Server level. The user can now enable depth monitoring for that particular queue.
To enable depth monitoring for the primary queue:
- Open Configs.cfg file and navigate to primary queue settings.
- Change DepthMonitoringEnabled to TRUE.
ObjectName=Fiorano.mq.ptp.Queues:Name="PRIMARYQUEUE",ServiceType=Queue,type=config Depth Monitoring is enabled for the primary queue.
A User can configure the depth levels so that notifications are raised. To configure Depth levels, go to queue settings and change DepthMonitoringLevels. The value of DepthMonitoringLevels should be integers separated by commas. A sample value will be 'DepthMonitoringLevels=10,20,30'. This depth level is applicable to all queues. All queues will take the Depth levels set at Queue settings if individual depth levels are not set. If a User wishes to set different levels for different queues, the User needs to change these settings for all queue levels.
To receive notifications, a User needs to register the JMX notification listener on the Server. The file JMXNotifications.java will register notification listeners to the Server is present at fmq/samples/JMX. A User needs to register the listener to Queue Event Manager:
The above command receives notifications when the queue depth crosses the values defined by DepthMonitoringLevels.
35.2.2 Configuring Through Studio
- Right-click the Profiles node in the Profile Manager Explorer, and select the Open Profile option from the pop-up menu.
- In the Select Profile Directory dialog, select the FioranoMQ profile directory and click the Open button.
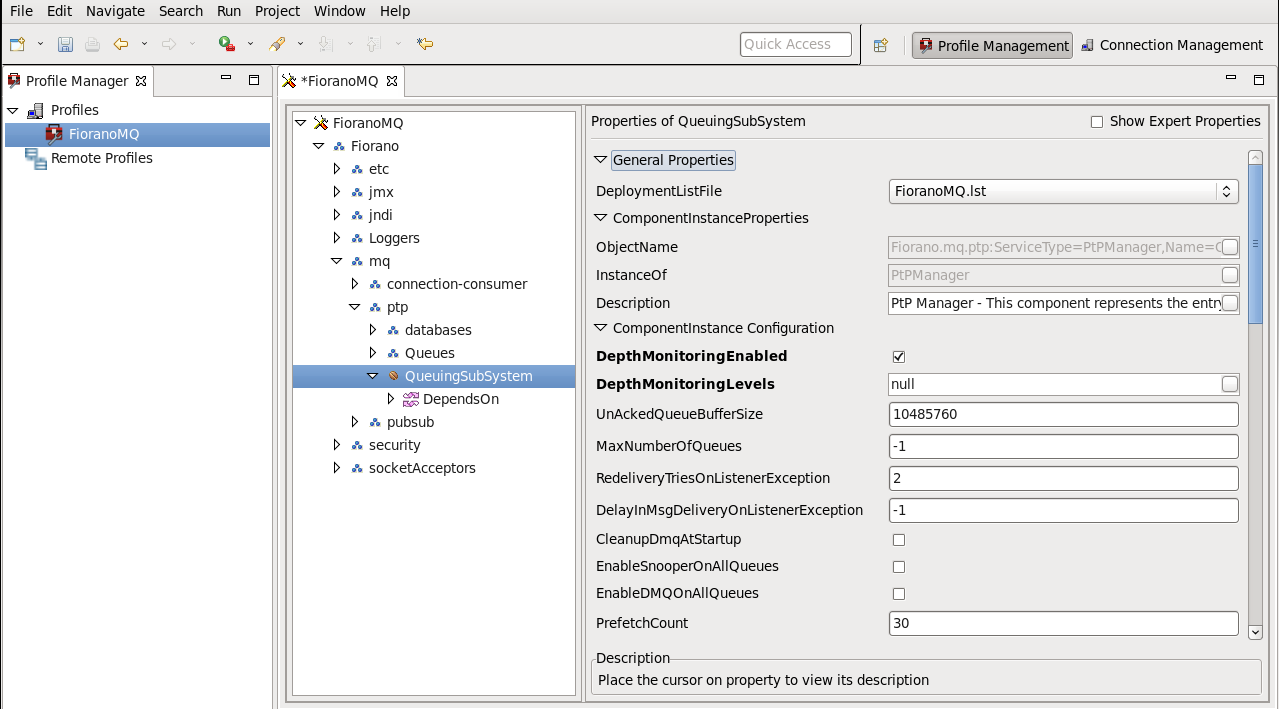
For enabling depth monitoring at server level:
In Profile Manager, navigate to FioranoMQ > Fiorano > mq > ptp > QueuingSubSystem and go to the Properties of QueuingSubSystem pane as shown in the figure below.
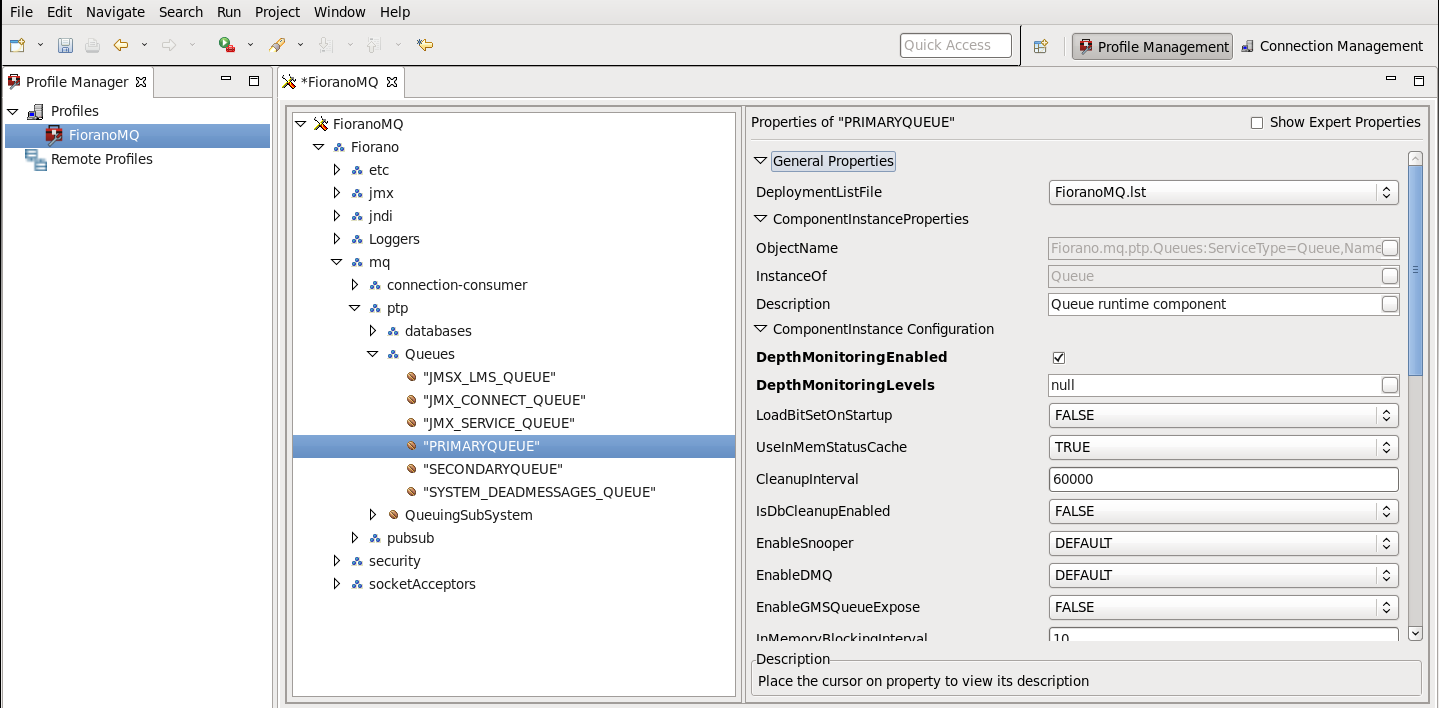
For enabling depth monitoring at particular queue:
In Profile Manager, navigate to FioranoMQ > Fiorano > mq > ptp > Queues > <particular queue> and go to the Properties of selected queue pane as shown in the figure below