The FioranoMQ Server will not, by default, measure message throughput. However, a user can configure certain parameters to see related throughput statistics.
35.1.1 Server Side Configuration
Viewing Server Monitoring results:
Online
- Login to FMQ-JMX in the Server Explorer pane by allocating the appropriate RMIConnector property values in the Properties of FMQ-JMX pane.
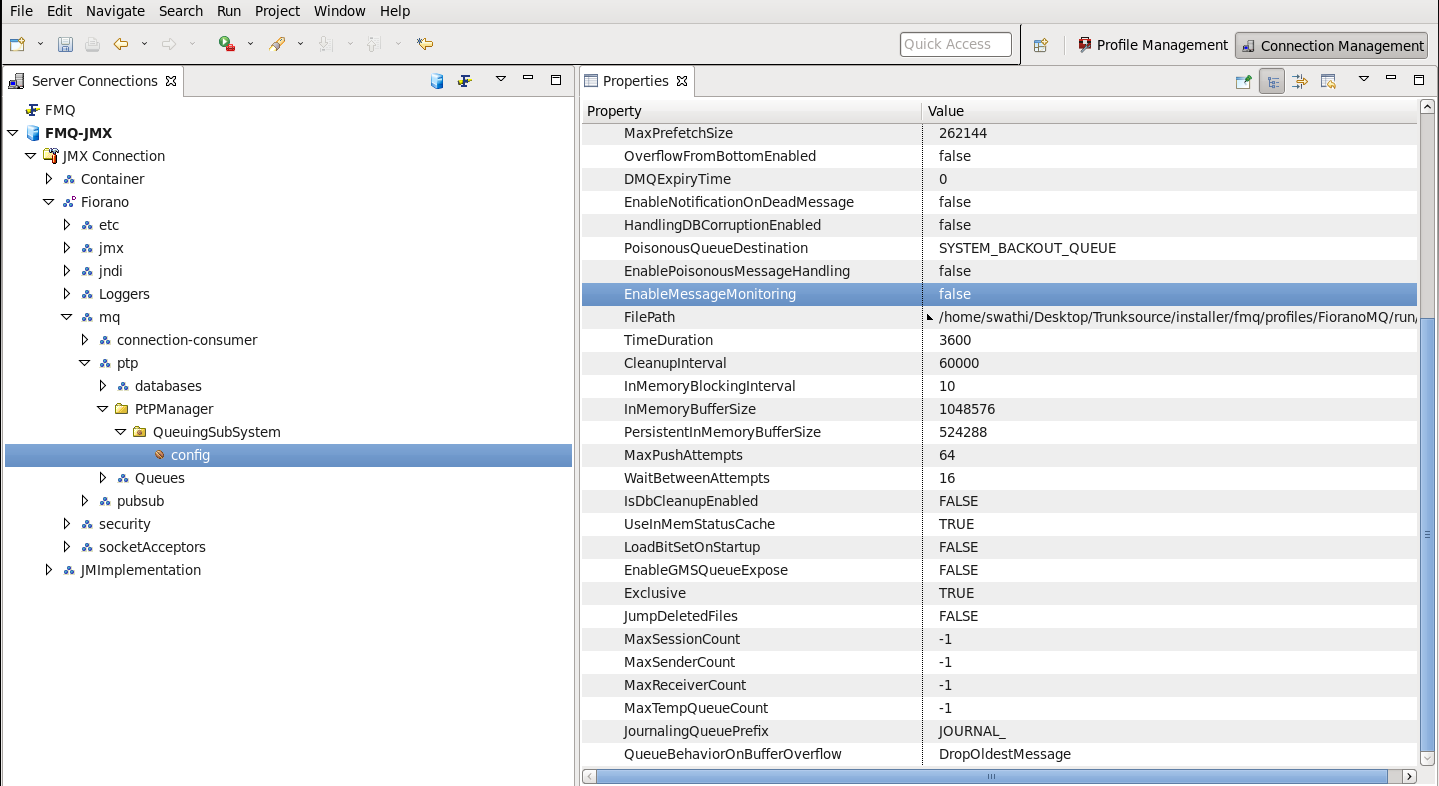
- In FMQ-JMX, navigate to JMX-Connection > Fiorano > mq > ptp > PtpManager > QueuingSubSystem > config and go to the Properties of QueuingSubSystem pane as shown in the figure below.
Offline
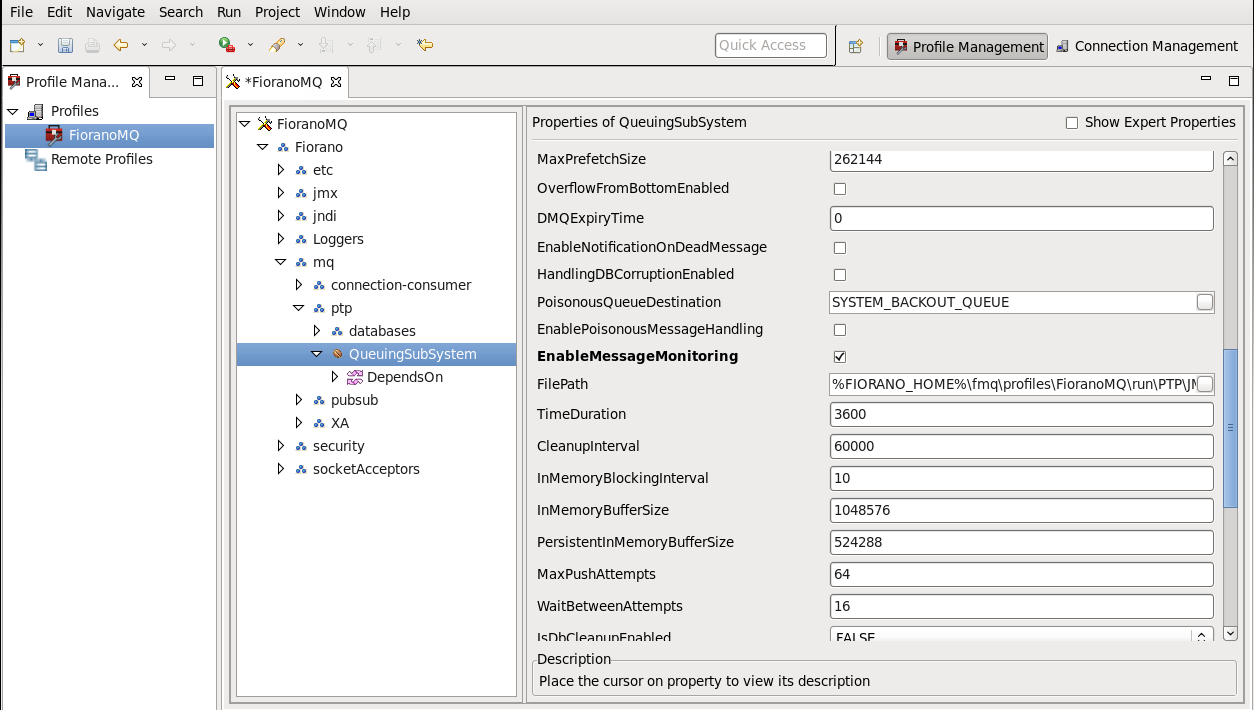
- Right-click the Profiles node in the Profile Manager Explorer, and select the Open Profile option from the pop-up menu. In the Select Profile Directory dialog, select the FioranoMQ profile directory and click the Open button.
- In Profile Manager, navigate to FioranoMQ > Fiorano > mq > ptp > QueuingSubSystem and go to the Properties of QueuingSubSystem pane.
Editing Properties
- EnableMessageMonitoring: Set this property to 'yes' to enable the monitoring APIs. By default this property is set to 'no'.
For every monitored value there the initial value which is obtained when the message monitoring is enabled. This initial value is displayed at the end of the value in parenthesis.
- FilePath: Set this to the absolute location where the data is present. FIORANO_HOME environment variable needs to be set for this path for enabling proper location in the system.
The Filepath can be changed at any instance. If the User has assigned a non-existing path, the Server tries to create the directory structure. However, changing the Filepath leads to loss of all data apart from initial values obtained when message monitoring is enabled. The Complete path is given in the Filepath so that the User can assign any location other than the run directory of FMQ server profile. If the location directory is not pointing to the FioranoMQ profile run directory, the clearing database does not remove the data. When the server is restarted the User can see the old data present in that directory. However, the initial values which are used for comparison are lost.
- TimeDuration: Sets the duration (last completed Time Interval) for which results are returned.
The Time Duration must be more than two seconds for better results.
Using Server Monitoring APIs of PTP Subsystem
The APIs listed below are to be added for Server monitoring. To view the APIs and the results:
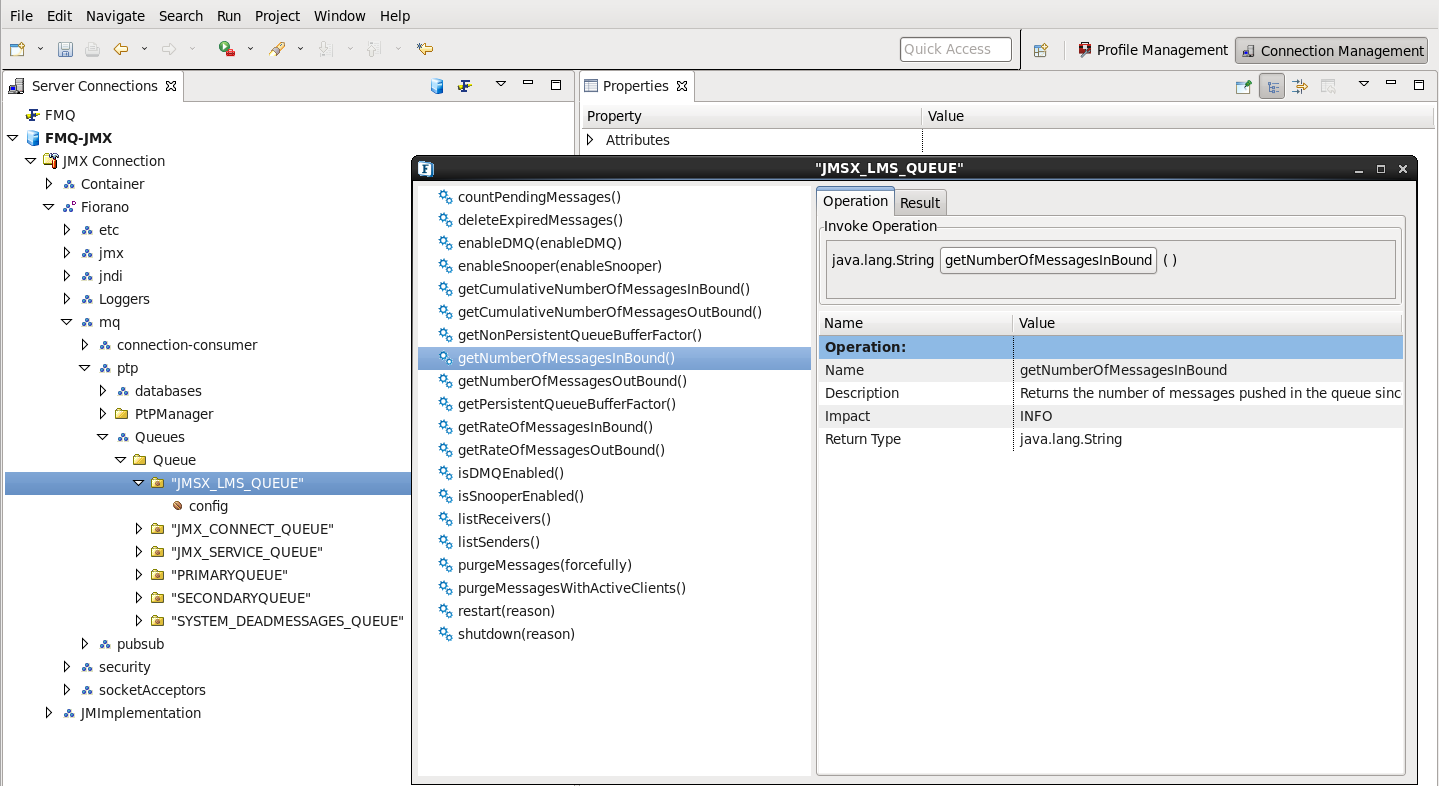
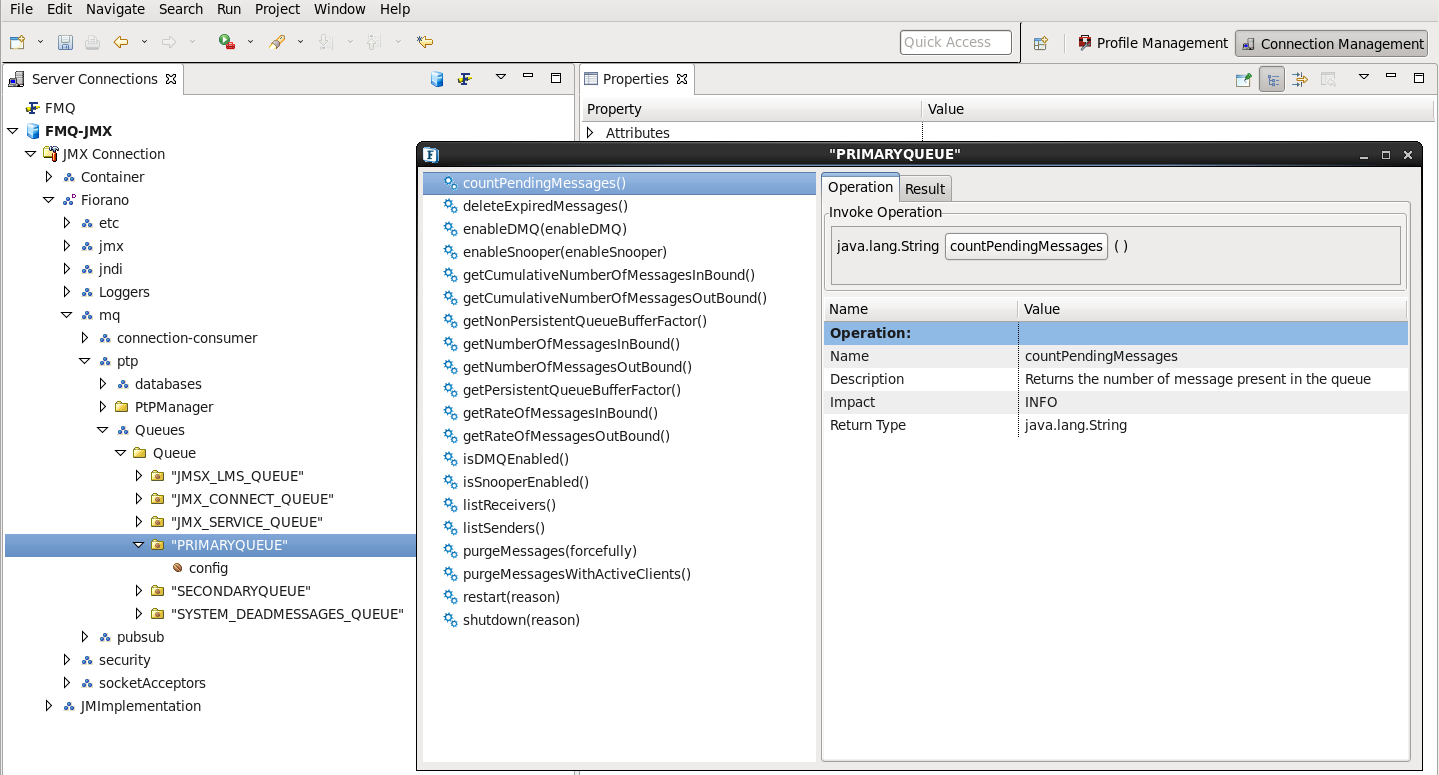
- Login to FMQ-JMX in the Server Explorer pane and navigate to FMQ-JMX-> JMX Connection-> Fiorano-> mq-> ptp->Queues-> Queue-> PRIMARYQUEUE (JMX_SERVICE_QUEUE). Now you can see the following APIs in the MBean Exlporer pane at the bottom of the window.
- To see the result of an API, select Operations in the Mbean explorer pane. Select an API and right-click, and then click the Invoke option from the pop-up menu as shown in the figure below.
- getNumberOfMessagesInBound This method returns the number of messages added to the queue of the previous TimeDuration in seconds.
- getRateOfMessagesInBoundThis method returns the average number of messages added to the queue within one second in of the previous TimeDuration seconds.
- getNumberOfMessagesOutBoundThis method returns the number of messages removed from the queue in the previous TimeDuration in seconds.
- getRateOfMessagesOutBoundThis method returns the average number of messages removed from the queue within one second of the previous TimeDuration in seconds.
- countPendingMessages This method returns the number of messages present in the queue at any given second.
Using Server Monitoring APIs of PubSub Subsystem
The following APIs are added at the Topic level.
- Login to FMQ-JMX in the Server Explorer pane and navigate to FMQ-JMX > JMX Connection > Fiorano > mq > pubsub > topics > topic > PRIMARYTOPIC. It is possible to view APIs in the MBean Exlporer pane at the bottom of the window.
- To see an API select Operations in the Mbean explorer and right-click one of the APIs .Click the Invoke option from the pop-up menu.
- getNumberOfMessagesInBound This method returns the number of messages added to the queue in the last TimeDuration seconds.
- getRateOfMessagesInBound This method returns the average number of messages added to the queue within one second of the precious TimeDuration seconds.
- getMessageMonitoringData This method returns data in tabular form containing all the monitored data for a particular queue such as: NumberOfMessagesInBound, RateOfMessagesInBound
Using Server Monitoring APIs of QueueConnection
The APIs listed below are added to the QueueConnection level.
- Login to FMQ-JMX in the Server Explorer pane and navigate to FMQ-JMX > JMX Connection > Fiorano > mq > ptp > QueueConnection > PRIMARYQUEUE. It is possible to view the APIs in the MBean Exlporer pane at the bottom of the window.
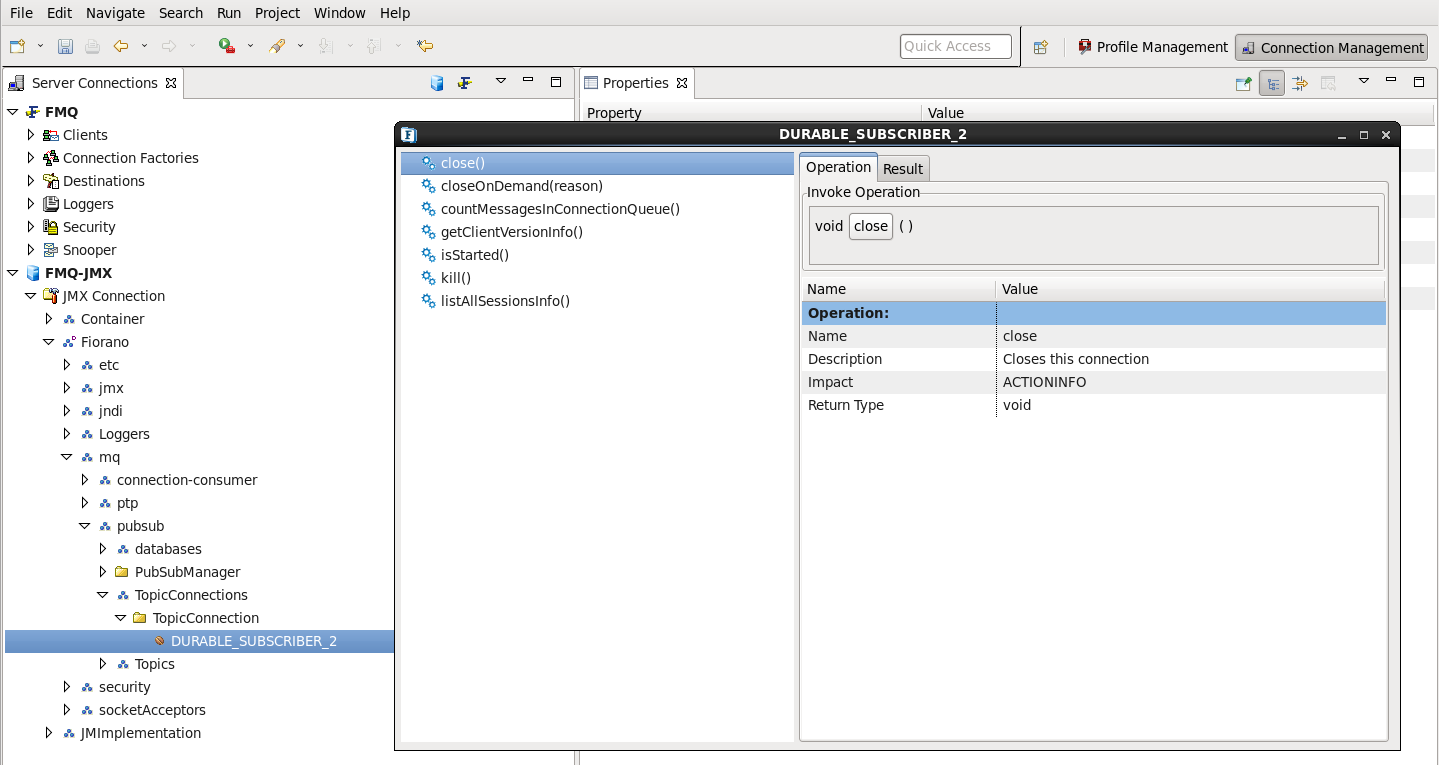
- To view an API, right-click and choose the API. Click the Invoke option from the pop-up menu as shown in the figure below.
- countMessagesInConnectionQueue This API returns the number of messages present in the connection queue buffer.
Using Server Monitoring APIs of TopicConnection
The following API was added at topic connection level.
- countMessagesInConnectionQueueThis API returns the number of messages present in the connection buffer.
35.1.2. Client Side Configuration
To monitor destinations 'EnableMessageMonitoring' the flag must be set to 'Yes'.
When a Producer or Consumer is created on FioranoMQ Server, hierarchical runtime MBeans are created on the Server. These MBeans required that methods are enabled.
- Client side Requirement:
Client ConnectionID, SessionID, ProducerID/ConsumerID should be set to identify instances on the Server. ConnectionID can be set using JMS apis SessionID, ProducerID/ConsumerID are set using the parameters listed below before connection creation is added. (This Java or equivalent code should be added to the client Java or correspoding code.)
All properties need not be added. Publisher creation "FIORANO_CONSUMERID" need not be set.
2. Consequences in Server side:
The properties are required to identify a client on a Server. If these properties are not set then the default values are used. For a durable subscriber ConsumerID need not be set and the one passed during creation will be used as its name. If more than one instance of a session involving producer/consumer are used then the serial number will be appended to the property. If a user creates more than one connection in the same JVM then the properties set before the creation of the connection will be the ones to take effect.
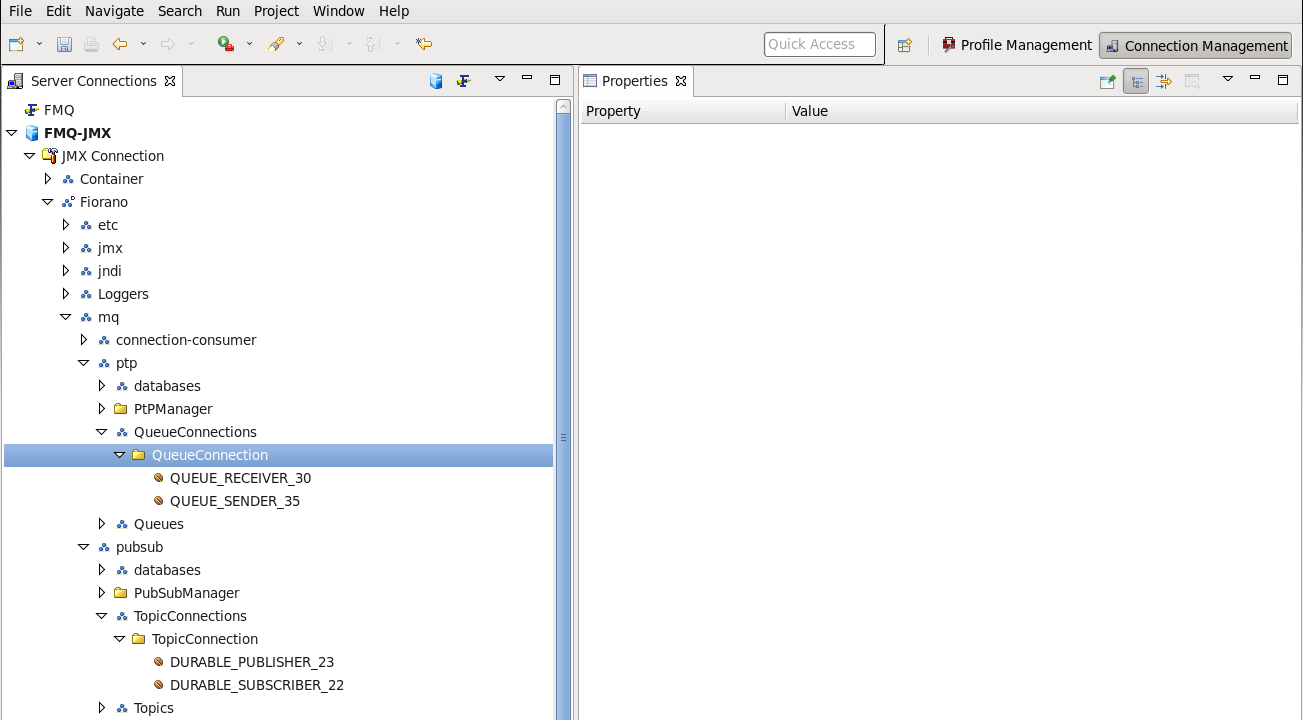
The image above displays how a User creates a QueueSender, QueueReceiver, Publisher, DurableSubscriber and two subscribers in the same session. For every ConnectionID the hashCode of that connection will be appended to it.
In the figure under SUBSCRIBERCONNECTION_25 there two subscribers are created. The first subscriber is named by the User and the second '1' appended to it.
APIs added at Destination level in pubsub:
- getNumSubscribedMsgs:
This API will return the number of messages that are received by the subscriber in the configInterval time configured in TopicSubSystem properties. DurableSubscriber message count starts when the durable subscriber is initiated. If the durable subscriber is closed and started again then the message count will be zero.
- getNumPublishedMsgs:
This APIl returns the number of messages that are published by the publisher in the configInterval time configured in TopicSubSystem properties.
APIs added at Destination level in PTP:
- getNumReceivedMsgs:
This returns the number of messages that are received by the receiver in the configInterval time configured in QueuingSubSystem properties.
- getNumSendMsgs:
This returns the number of messages that are sent by the sender in the configInterval time configured in QueuingSubSystem properties.
Few more JMX APIs are added at the destination level to list the number of Producers and Consumers within a destination.
- listSubscribers:
This returns the list of subscribers created on a particular topic.
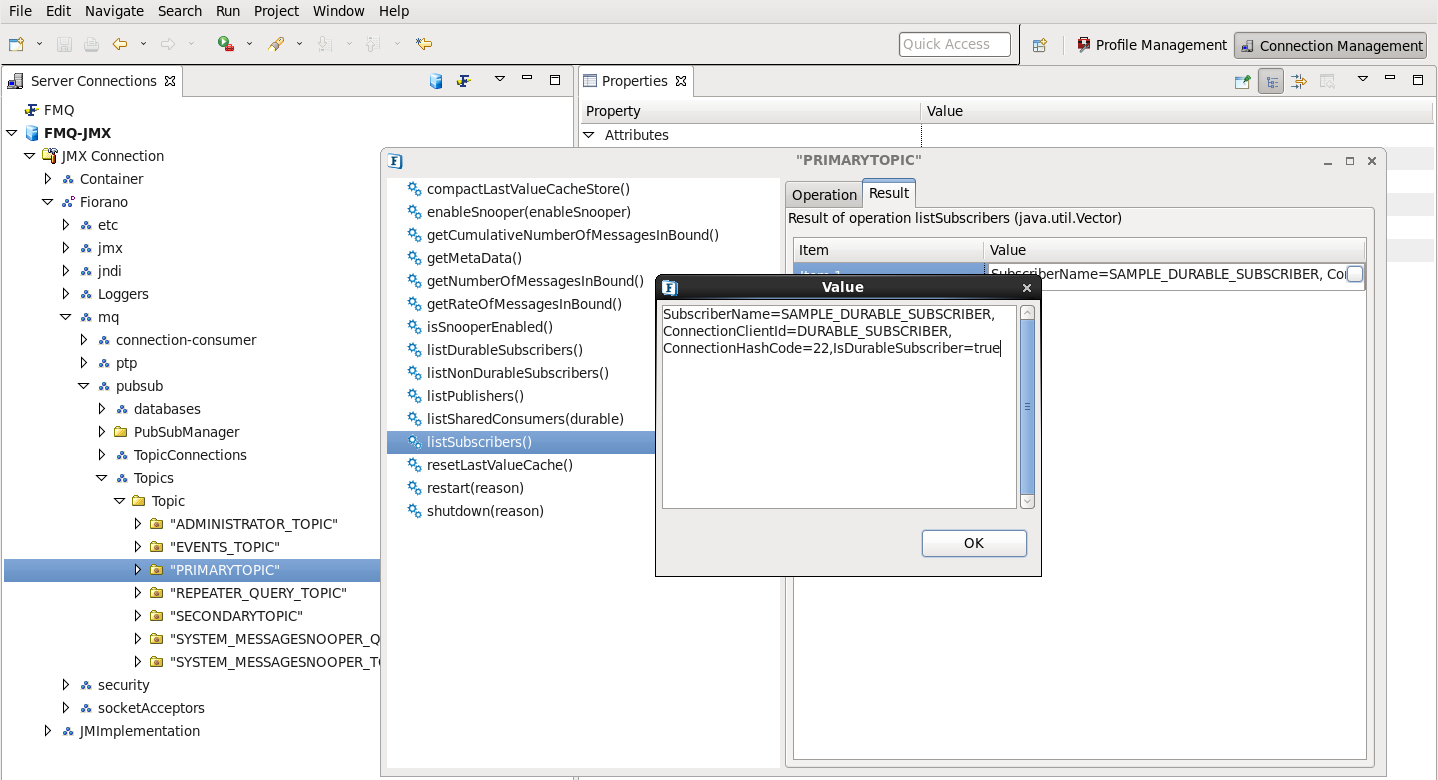
The figure shows 'SubscriberName' the MBeanName,'ConnectionClientID' which is the connection ID of the subscriber set from the client and 'ConnectionHashCode' is the hashcode. These parameters are required for identifying the connection. 'IsDurableSubscriber' indicates whether a subscriber is durable.
- listPublishers:
This returns the list of publishers created on that particular topic.
- listReceivers:
This returns the list of receivers created on that particular queue.
- listSenders:
This returns the list of senders created on that particular queue.
35.1.3 Performance graphs
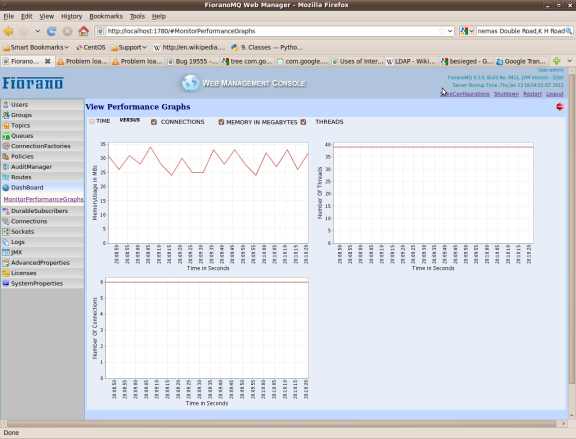
Performance graph showing connections, memory usage and threads can be seen through Web Management console.
Steps are:
- Log-in to Web Management console.
- From Left hand side pane click on dashboard → select MonitorPerformanceGraphs. Options regarding performance graphs will appear on right hand side area.
- Select among options:
- CONNECTIONS
- MEMORY IN MEGABYTES
- THREADS
The corresponding graph will be plotted against time. Following figure shows a screen shot of this view.
35.1.4 Logging server Monitoring information
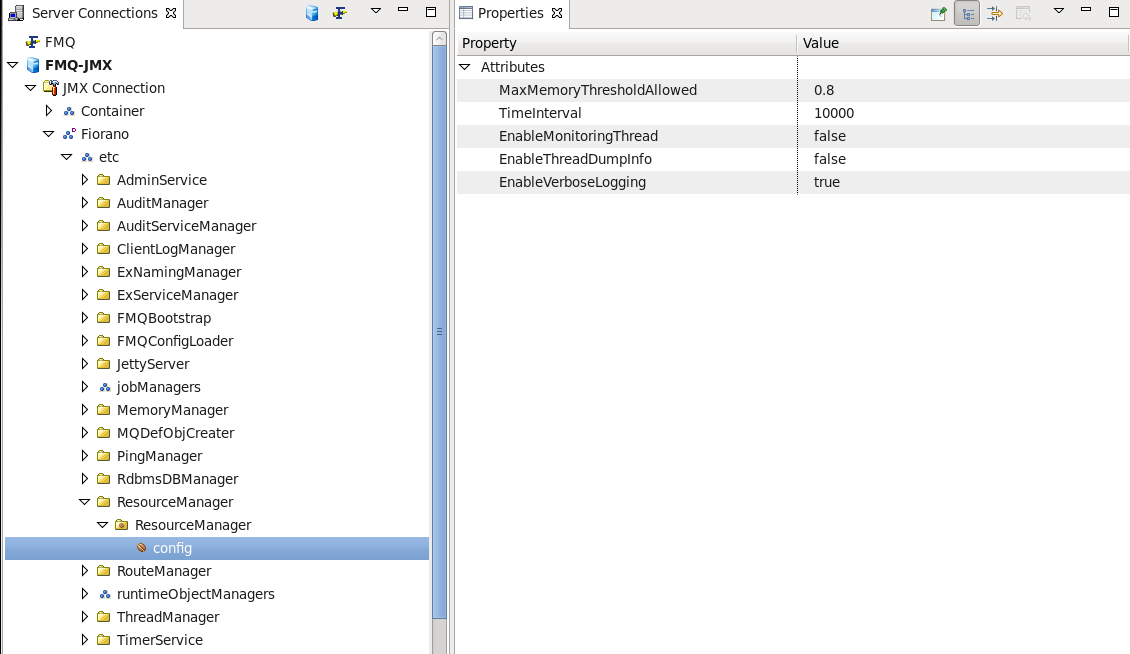
Monitoring Thread can be enabled for FMQ server by setting "EnableMonitoringThread" parameter. Following screen shot shows how to enable it form FMQ-JMX log-in. Log-in to FMQ-JMX through Studio and follow tree FMQ-JMX > JMX Connection > Fiorano > etc > Resource Manager > ResourceManager > config.
Moreover through Web Management Console this parameter can be configured. For doing so through Web Management Console log-in to Web management console-> From left hand side pane click on AdvancedProperties → select ConfigureAdvancedProperties → From Right hand side tree options expand "ResourceManager Properties" → invoke "EnableMonitoringThread" operation and enable it.
After enabling this parameter following monitoring information will be logged in file "FioranoMQ_home\fmq\profiles\<profile name>\run\logs\monitor.txt":
- Number of Connections
- Number of Sessions
- Number of Producers
- Number of Consumers
- Number of Activated Destinations
- Total Number of JVM Thread
- Used Memory of the Server
This information will be noted on a regular interval.