Various Keywords in the Fiorano logs that are saved in designated locations help in effective monitoring of resources. This article provides information on various monitoring attributes, log location and Keywords that help to identify, understand and differentiate the logs. Screenshots of Log file contents have been provided for a few contexts to have a fair idea about its appearance. However, images are not provided for the scenarios that hardly arise.
Fiorano Logs
Tables in the below sections is a reference to the File Name and Location of Fiorano Logs, which is classified according to its presence in three different Modules, that is FES, FPS and Components.
Logs in FES Module
Entry # | Log Type | Location(relative to FIORANO_HOME/runtimedata) | File Name |
|---|---|---|---|
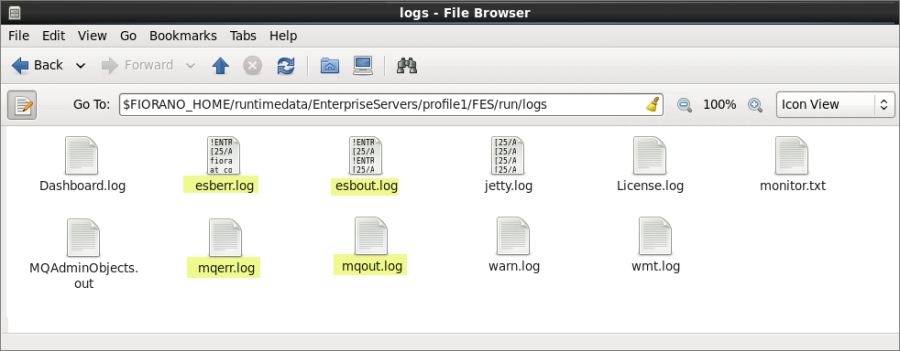
1 | FES Output | /EnterpriseServers/PROFILE_NAME/FES/run/logs/ | esbout.log |
2 | FES Error | /EnterpriseServers/PROFILE_NAME/FES/run/logs/ | esberr.log |
3 | Service Logs | /EnterpriseServers/PROFILE_NAME/service/ | service.log |
4 | JMS Output | /EnterpriseServers/PROFILE_NAME/FES/run/logs/ | mqout.log |
5 | JMS Errors | /EnterpriseServers/PROFILE_NAME/FES/run/logs/ | mqerr.log |
Example:
Logs in FPS Module
Entry # | Log Type | Location(relative to FIORANO_HOME/runtimedata) | File Name |
|---|---|---|---|
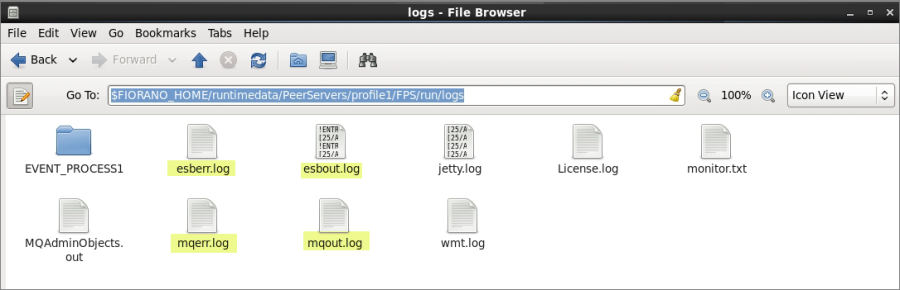
1 | FPS Output | /PeerServers/PEER_PROFILE/FPS/run/logs/ | esbout.log |
2 | FPS Error | /PeerServers/PEER_PROFILE/FPS/run/logs/ | esberr.log |
3 | Service Logs | /PeerServers/PEER_PROFILE/service/ | service.log |
4 | JMS Output | /PeerServers/PEER_PROFILE/FPS/run/logs/ | mqout.log |
5 | JMS Errors | /PeerServers/PEER_PROFILE/FPS/run/logs/ | mqerr.log |
Example:
Logs in Components Module
Entry # | Log Type | Location(relative to FIORANO_HOME/runtimedata) | File Name |
|---|---|---|---|
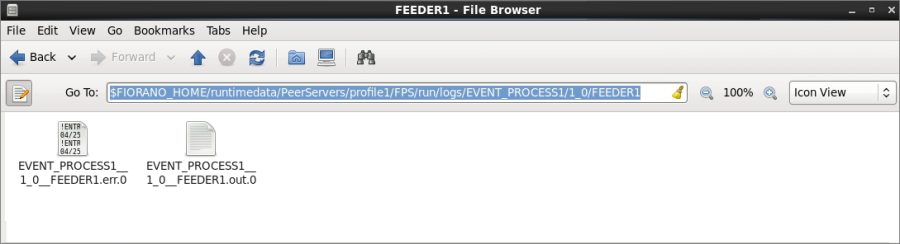
1 | Output Logs | /PeerServers/PEER_PROFILE/FPS/run/logs/APP_NAME/APP_VERSION/SERVICE_NAME/ | APP_NAME_APP_VERSION_SERVICE_NAME.out.0 |
2 | Error Logs | /PeerServers/PEER_PROFILE/FPS/run/logs/APP_NAME/APP_VERSION/SERVICE_NAME/ | APP_NAME_APP_VERSION_SERVICE_NAME.err.0 |
Example:
Monitoring based on Module Logs
Error Logs
Application-specific Error logs
Represent errors with respect to application launch/stoppage.
For Location and File Name, refer: Entry #2 in Logs in FES Module section.
Keywords in the FES Error Log file
- ERROR [ApplicationControllerLogger]
- WARN [ApplicationControllerLogger]
Example: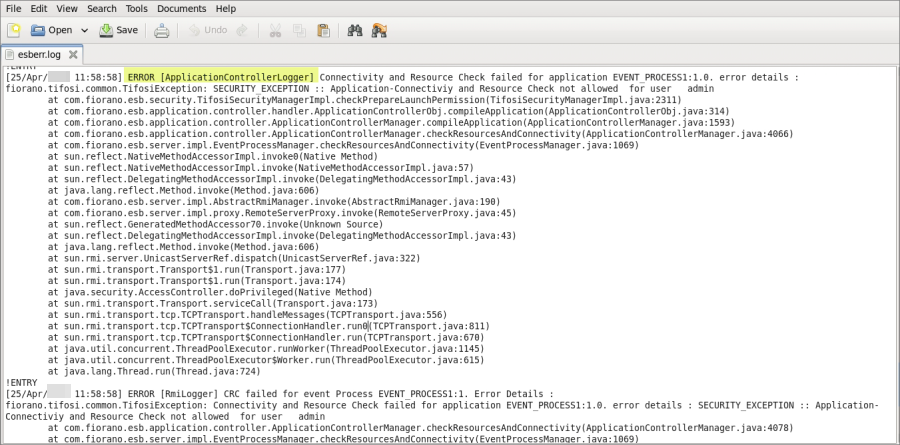
Component-specific Error logs
Represent errors in communication between components and Peer Server.
For Location and File Name, refer: Entry #2 in Logs in FPS Module section.
Keyword in the FPS Error Log file
- ERROR [StubManager]
Component Fault Logs
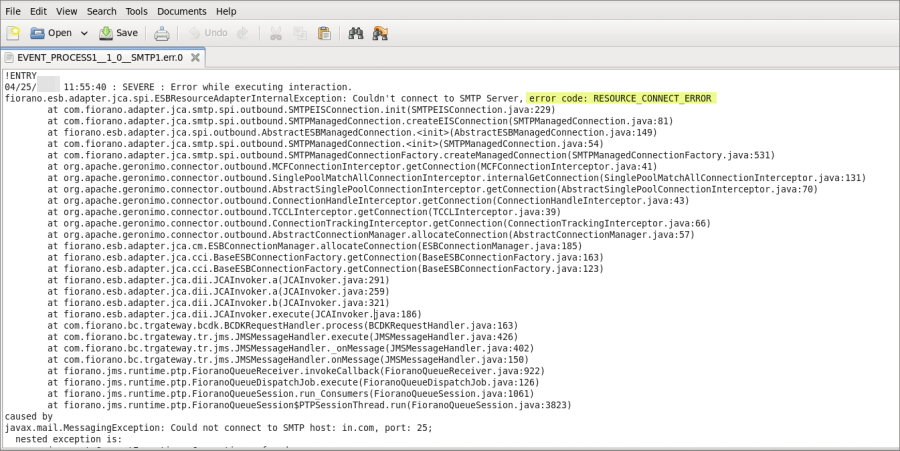
Represent errors generated when while connecting/interacting with DB, SMTP servers etc. These errors get logged in the respective log file of the component.
For Location and File Name, refer: Entry #2 of Logs in Components Module section.
Keyword in the Component Error Log file
- error code: <ERROR NAME>
Possible values of the variable: ERROR NAME:
- INVALID_REQUEST_ERROR
- RESPONSE_GENERATION_ERROR
- REQUEST_EXECUTION_ERROR
- RESOURCE_CONNECT_ERROR
- RESOURCE_CONNECTION_LOST_ERROR
Example:
Component Performance Log
Helps to monitor performance of certain components such as DB, SMTP and MSMQ, at INFO log level, the request execution time is logged in the output log file of components.For Location and File Name to monitor Performance Trending, refer: Entry #1 of Logs in Components Module.
Keyword in the Component Output Log file
- INFO : Time taken (milli sec) to process request:
Server Availability Logs
While servers run as a service, the status, downtime, and uptime can be measured from the Service log files.
For Location and File Name of the logs to monitor Server Availability, refer: Entry #3 of Logs in FES Module and Logs in FPS Module sections.
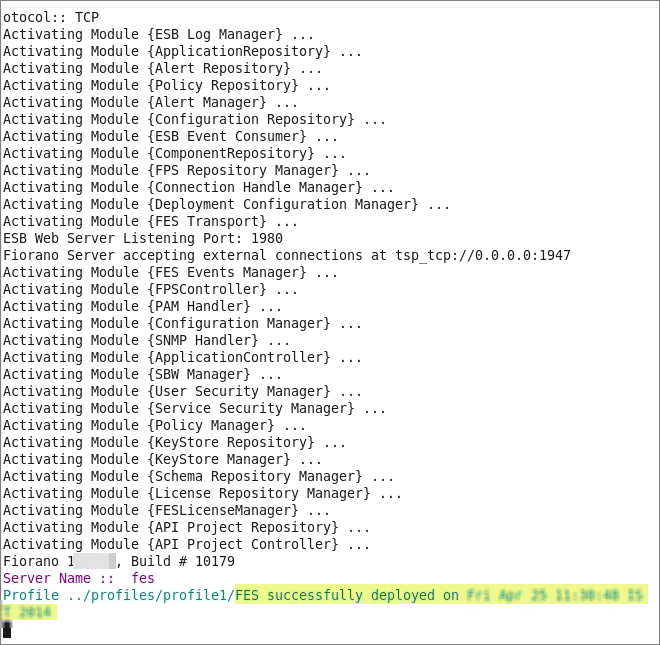
Normal Mode
Servers | Keywords for Server Start up | Keywords for Server Shutdown |
|---|---|---|
FES | FES successfully deployed on <Timestamp> | Container shutdown successful at <Timestamp> |
FPS | FPS successfully deployed on <Timestamp> | Container shutdown successful at <Timestamp> |
Example:
HA Mode
Start up Keywords
Scenario 1: Only one of the two servers is running.
Keywords for the Running Server (FES or FPS) |
|---|
<Timestamp> Primary(Secondary) Server switched to STANDALONE |
Scenario 2: Both the servers are running.
Depending on which server goes active, below keywords can be found in the Active server's log.
Keywords for the Active Server in the Running Serves (FES and FPS) |
|---|
<Timestamp> Primary(Secondary) Server switched to STANDALONE |
<Timestamp> Old status of remote server = WAITING |
<Timestamp> New status of remote server = PASSIVE |
Shutdown Keywords
Scenario 1: Both the servers are running.
Depending on which server goes down, these keywords can be found in the servers as below.
Keywords for Active Server: FES/FPS | Keywords for Passive Server: FES/FPS |
|---|---|
<Timestamp> Old status of remote server = ACTIVE<Timestamp> New status of remote server = DEAD | <Timestamp> Old status of remote server = PASSIVE<Timestamp> New status of remote server = DEAD |
Scenario 2: One of the two servers is shutdown.
After shutdown of one of the two servers, the other server will move to STANDALONE state and can be monitored using the following keyword.
Keyword for Running Server (other one shutdown):
<Timestamp> Primary(Secondary) Server switched to STANDALONE
Gateway Machine Down/Up
In case of HA, there are chances of the Gateway machine going down.
Gateway machine can be monitored using the following keywords in the active server:
Keyword for Gateway Machine Down | Keyword for Gateway Machine Up |
|---|---|
<Timestamp> WARNING:: Gateway Machine (<Machine_IP>) might be down | <Timestamp> INFO:: Gateway Machine (<Machine_IP>) is up |
Replication Failure – Keyword:
<Timestamp> ACTIVE TRANSITION call failed, Server will stay in STANDALONE state.
Application Availability Logs
Applications up-time and downtime can be checked in the FES output log.For Location and File Name of the logs to monitor Application Availability, refer: Entry #1 of Logs in FES Module section.
Application Launch
Keywords for Application Launch:
- INFO [ApplicationControllerLogger] Application APPLICATION_NAME with version APPLICATION_VERSION is launched successfully
- INFO [ApplicationControllerLogger] All service instances of Application APPLICATION_NAME:APPLICATION_VERSION are started
Application Stoppage
Keyword for Application Stoppage:
INFO [ApplicationControllerLogger] Application APPLICATION_NAME:APPLICATION_VERSION is stopped
Example:

Service Availability Logs
Logs related to the availability of a component are logged in FPS output logs.
For Location and File Name of the logs to monitor Service Availability, refer: Entry #1 of Logs in FPS Module section.
Service Start
Keyword for Component/Service Start:
INFO [Core] Service instance <SERVICE> in event process <APP_NAME>:<APP_VERSION> started
Example:
Service Stoppage
Whether the component stopped intentionally or otherwise, the respective log will be available in FPS Output Log.
Keyword for Component/Service Stoppage: INFO [Core] Service instance <SERVICE> in event process <APP_NAME>:<APP_VERSION> stopped
Configuration Dependent Error Logs
JVM Heap Size / Memory Allocation
Any error in Memory allocation will be reported in error logs of respective modules.For Location and File Name of the logs to Memory Allocation, refer: Entry #2 of Logs in Logs in FES Module, Logs in FPS Module and Logs in Components Module sections.
Keyword for JVM Heap Error: java.lang.OutOfMemoryError
TCP Connection timeout value
Any timeout between Enterprise Server and Peer Server can cause state update issues. These issues will be logged in FES Error Logs.
For Location and File Name of the logs to Memory Allocation, refer: Entry #2 of Logs in FES Module section.
Keyword for Connection Timeout: Exception String in Proxy: fiorano.jms.common.FioranoException: REQUEST_TIMED_OUT
Security Breach Logs
Errors pertaining to security breaches get logged in FES Error Logs.For Location and File Name of the logs for security breach, refer: Entry #2 of Logs in FES Module section.
Keywords for Security breaches:
- WARN [ConnHandlerLogger] User with username - admin failed to log in
- SECURITY_EXCEPTION
Example: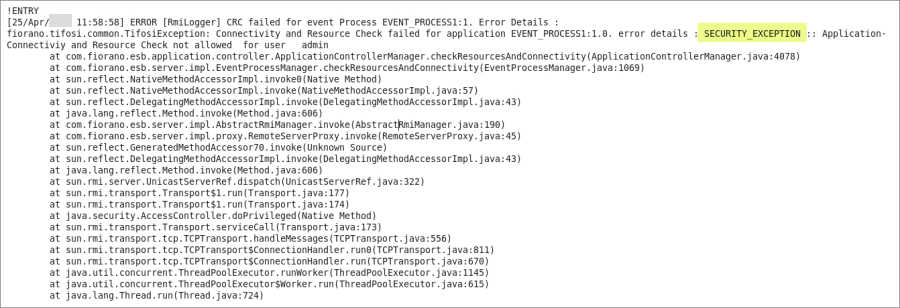
JMS logs
JMS level logs of servers will be available in Server log files. In general, these errors will result in appropriate and more meaningful errors in output and error logs of Servers.
For Location and File Name of the logs to monitor JMS errors, refer: Entries #4 and #5 of Logs in FES Module and Logs in FPS Module sections.
Keywords for JMS errors:
- FATAL
- ERROR
Monitoring Based on Log Severity
Exception logs are available for various levels of severity.
Logs on Servers
Output Logs
These logs can be found in output logs of server modules.
For Location and File Name of the Output logs for severity, refer: Entries #1 and #4 of Logs in FES Module and Logs in FPS Module sections.
Severity logs - Keywords:
- INFO
- DEBUG
- TRACE
Error Logs
These logs can be found in error logs of server modules.
For Location and File Name of the Error logs for severity, refer: Entries #2 and #5 of Logs in FES Module and Logs in FPS Module sections.
Severity logs on error – Keywords:
- ERROR
- WARN
- FATAL
Logs on Components
Component logs are also available for various levels of severity.
Output Logs
These logs can be found in output logs of Component modules.
For Location and File Name of the Output logs for severity on Components, refer: Entries #1 of Logs in Components Module section.
Severity logs – Keywords:
- INFO
- CONFIG
- FINE
- FINER
- FINEST
Error Logs
These logs can be found in error logs of Component modules.
For Location and File Name of the Error logs for severity on Components, refer: Entries #2 of Logs in Components Module section.
Severity logs on error – Keywords:
- SEVERE
- WARNING