Fetch Process ID
Server's Process ID
Get the server's JVM Process ID.
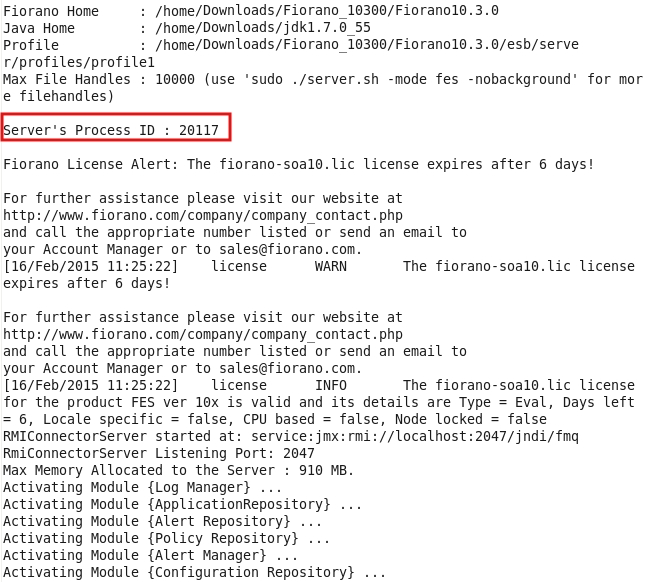
Figure 1: Server Console showing Server's Process ID
Component's Process ID
Component Process ID can be fetched for components running as separate process using the following steps:
- Login to ESB Dashboard and go to the Applications page.
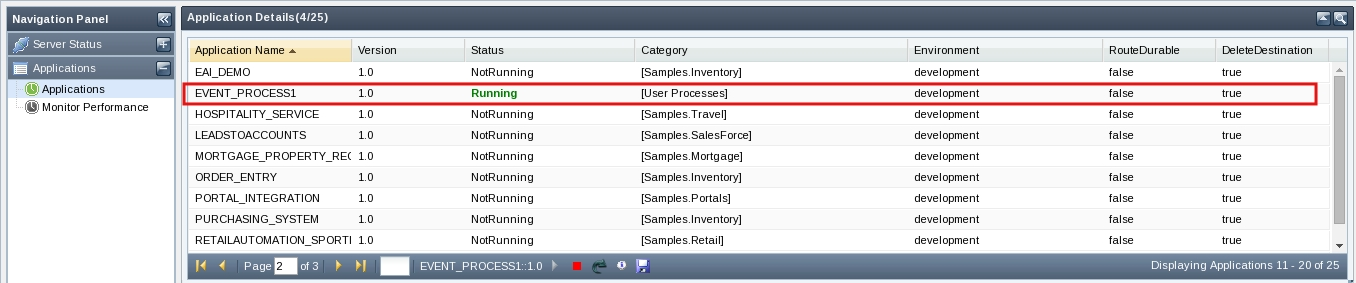
Figure 2: Applications Page
- Select the application which has the component for which the Process ID needs to be identified. The ServiceDetails section below the Application Details section contains the required component's Process ID.
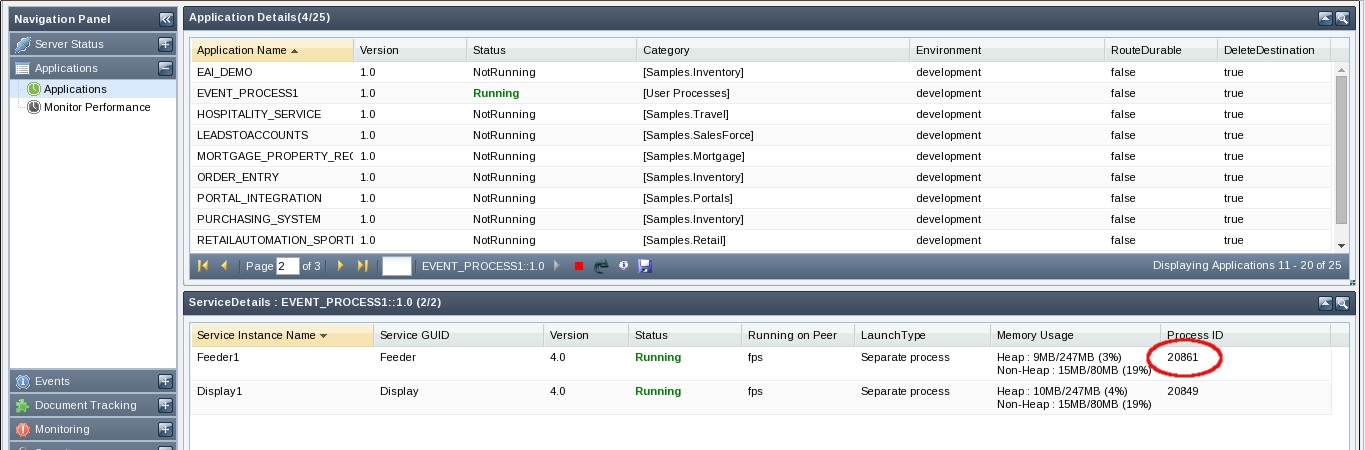
Figure 3: Service Details
Server and Component Thread Dumps
In case a server/component is seen to be non performing due to any unforeseen reason, server/component thread dump can be taken, which helps the support team analyse and understand the issue because of which the performance is being affected. This section explains the procedure to fetch the thread dumps from a working Fiorano setup.
Server Thread Dumps from Dashboard
Follow the steps given below to get the server thread dump:
- Login to ESB Dashboard and go to the server status page.
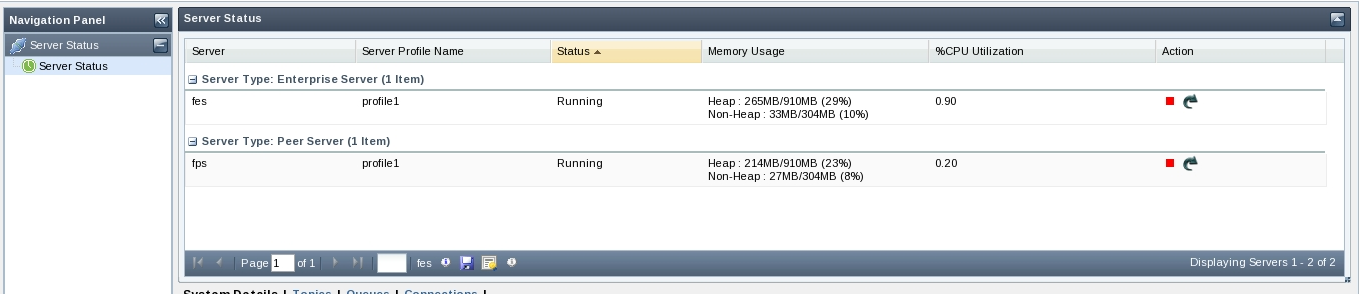
Figure 4: Server Status Page
- Select the server for which you want the thread dump.
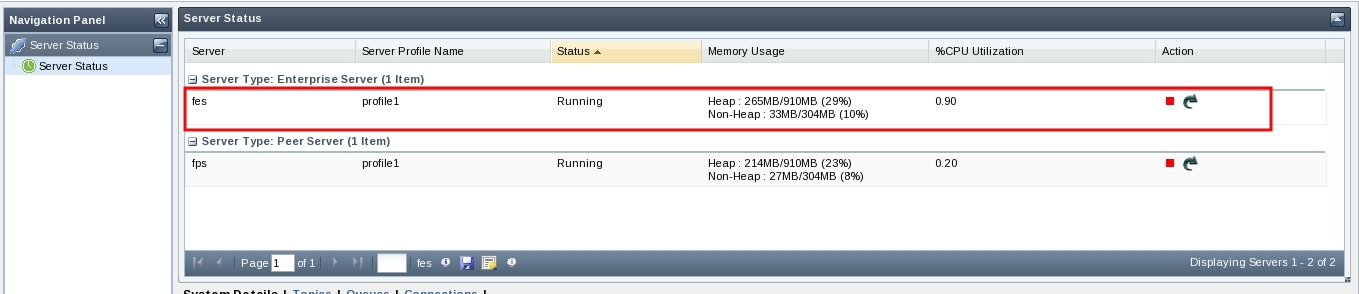
Figure 5: Server Selection
- Click the View Server Thread Dump Button
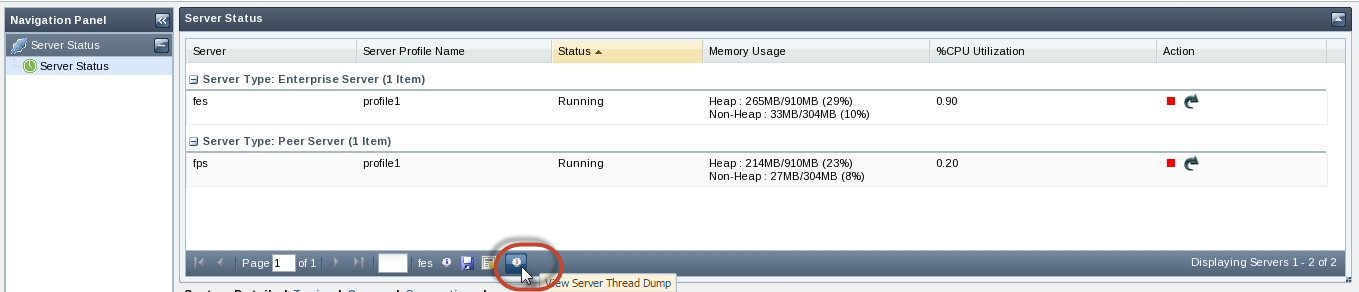
Figure 6: View Server Thread Dump
- A pop-up window appears showing the thread dump. Click Download to save the thread dump to file.
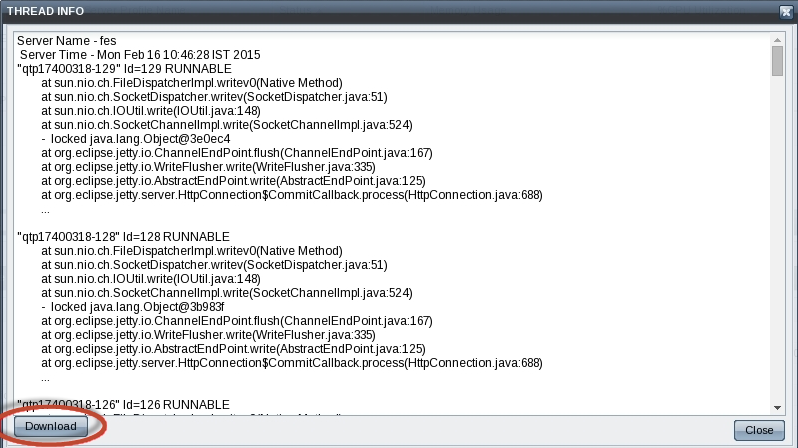
Figure 7: Thread Info
Server Thread Dumps from JVM Process ID using jstack
After fetching server's process ID (refer to the Fetch Server Process ID section), to get the thread dump using jstack, open a new console window and use the command below to store the thread dump to the threadDump.txt file:
![]()
Figure 8: jstack command
To analyze the status of the each thread of the server, take 5 times of threaddumps with a time interval of 5 seconds.
Component Thread Dumps from JVM Process ID using jstack
Component Process ID can be fetched for components running as separate process using the following step:
After fetching component's Process ID, use the jstack command to get the thread dump of the component:
Figure 9: jstack Command
Server and Component Heap Dumps
Server Heap Dumps from JVM Process ID using jmap
After fetching server's process ID (refer to the Server's Process ID section), to get the heap dump using jmap, open a new console window and use the following command to store the heap dump to heapDump.bin file:
jmap -dump:format=b,file=heapDump.bin <pid> ![]()
Figure 10: jmap Command
Component Heap Dumps from JVM Process ID using jmap
After fetching component's Process ID, use the jmap command to get the heap dump of the component:

Figure 11: jmap Command