Fiorano Webconsole provides a web-based monitoring tool for the Fiorano ESB Network and hence is commonly called as the Dashboard. Apart from the monitoring feature, it also provides support for launching, stopping and restarting an application using a web interface. Below section gives a comprehensive insight on how to log on to the Dashboard and about the features available in each section of the Dashboard.
Login Page
Fiorano ESB Webconsole can be accessed by starting the Fiorano Enterprise Server (FES) and then opening http://localhost:1980/ESBDashboard on a web browser.
Alternatively, access the Fiorano Web Container from the link present in the welcome page at http://localhost:1980.
Log in by entering the credentials configured for the FES; default credentials are:
- Username: admin
- Password: passwd
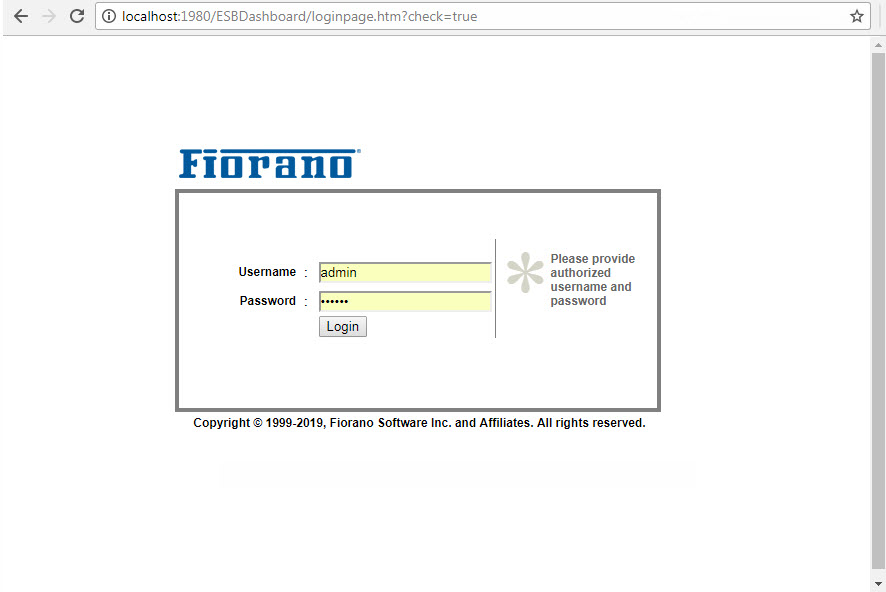
Figure 1: Fiorano Web Console Login Page
Each tab under the left navigation panel in the Fiorano Web Console, which is listed below, helps to accomplish various tasks.
Server Status
Server Status tab shows the details of the available Fiorano Servers. The top view shows the running status, memory usage and CPU Utilization. Further details are available on clicking the server links, which loads the bottom view with the following details:
Server Details
Displays the basic details of the server. Click the server name present under Server column to display the details under Server Details tab below.
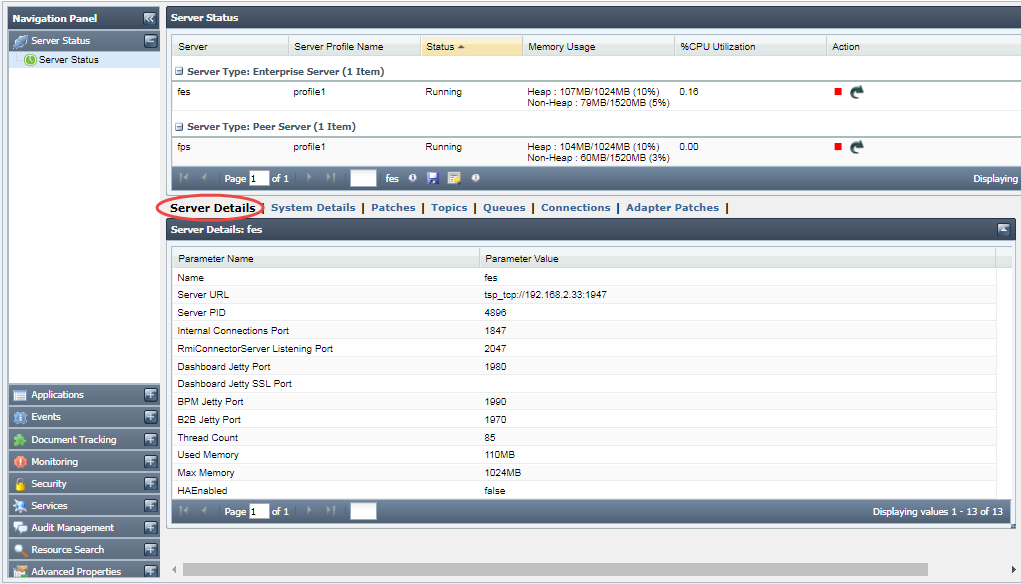
Figure 2: Server Status tab showing FES details
System Details
O/S and JVM statistics of the server
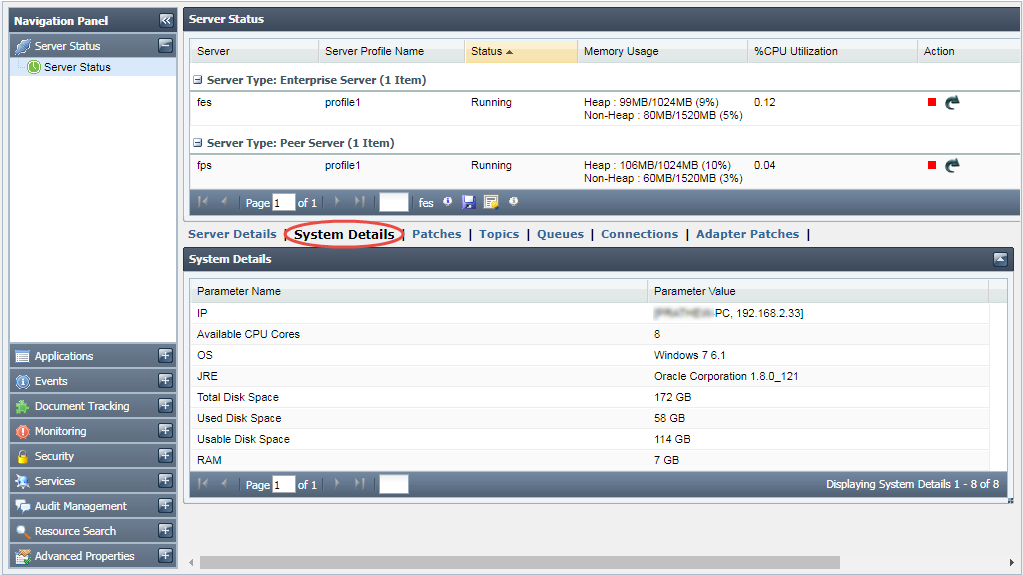
Figure 3: Server Status tab showing System details
Patches
This section lists details of server patches that are installed/uninstalled/failed.
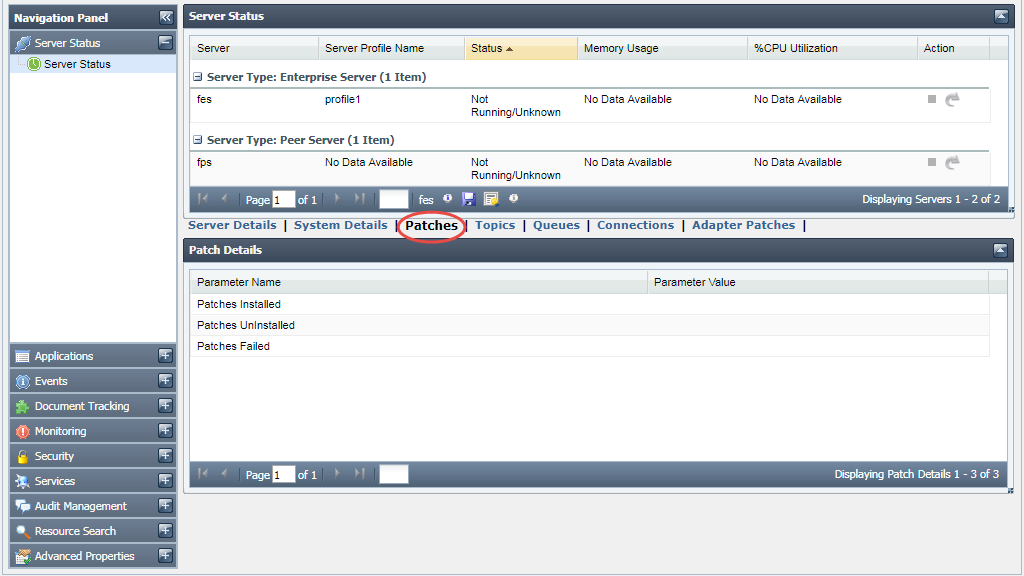
Figure 4: Patches tab which displays details of installed/uninstalled/failed patches
Topics
List of JMS topics present in the server.
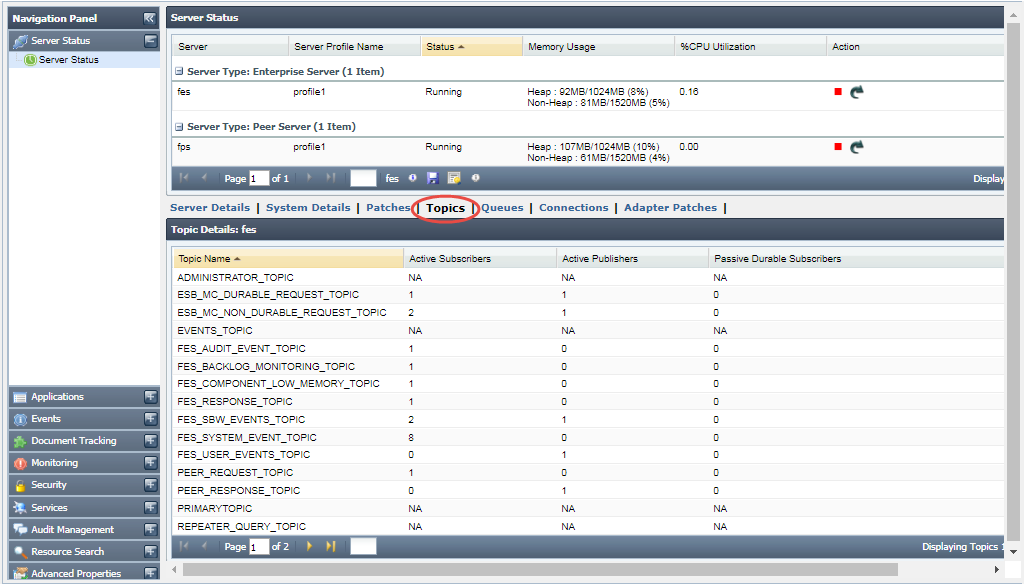
Figure 5: Server Status tab showing topics created by FES
Queues
List of queues present in the server.
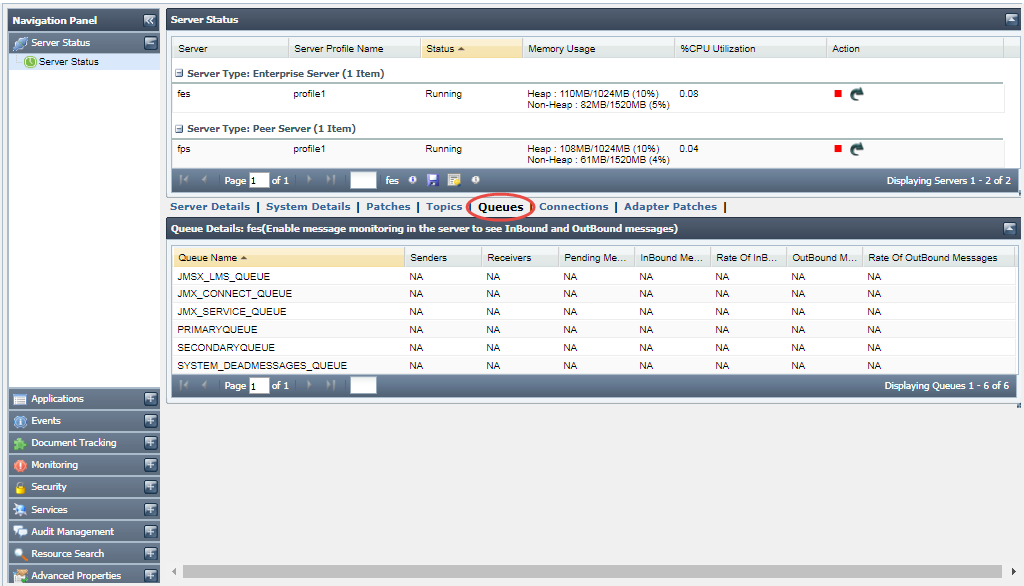
Figure 6: Server Status tab showing queues created by FES
Connections
List of connections created by the server.
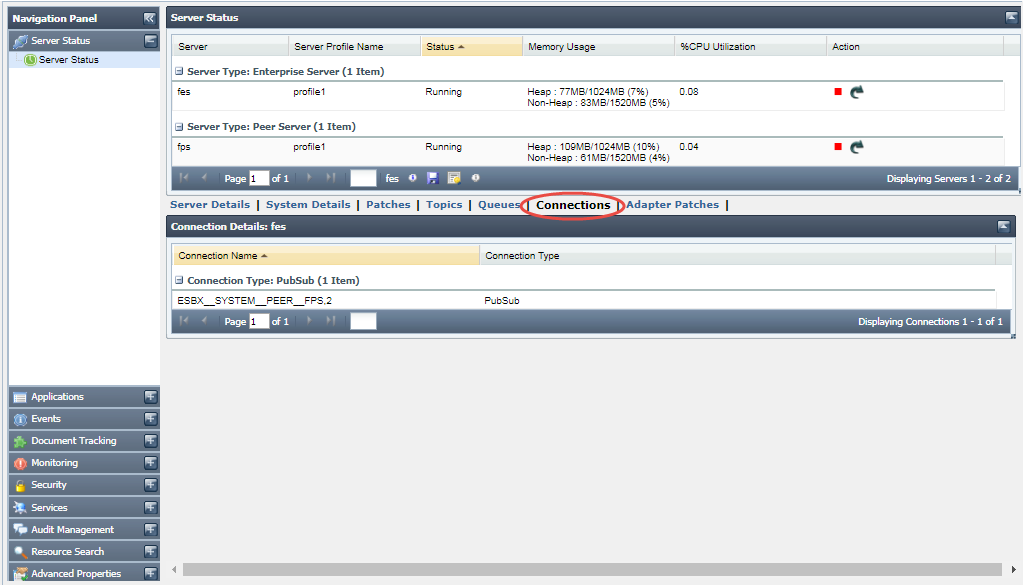
Figure 7: Server Status tab showing connections created on FES
Adapter Patches
This section displays the patches installed for a microservice. After importing the patch from the eStudio Micro Service Repository, the microservice details reflect here.
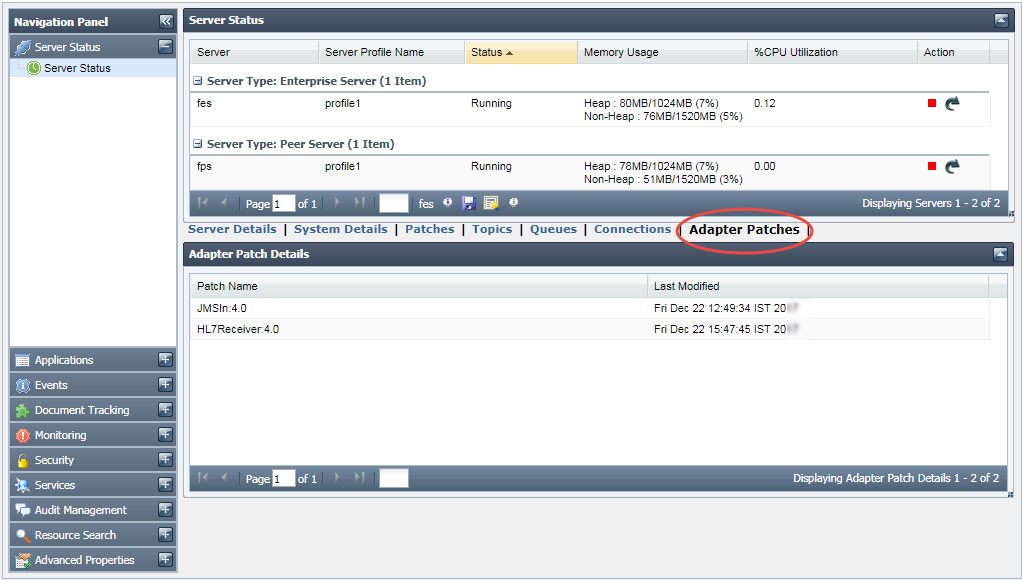
Figure 8: Adapter Patches tab showing the microservices patch details
Running Components
This section shows the microservices running on the FPS as a result of the Event Processes that are running. Click the fps node in the Server column under the Server Status section to display this option; the Adapter Patches option pertaining to FES will be switched with the Running Components option.
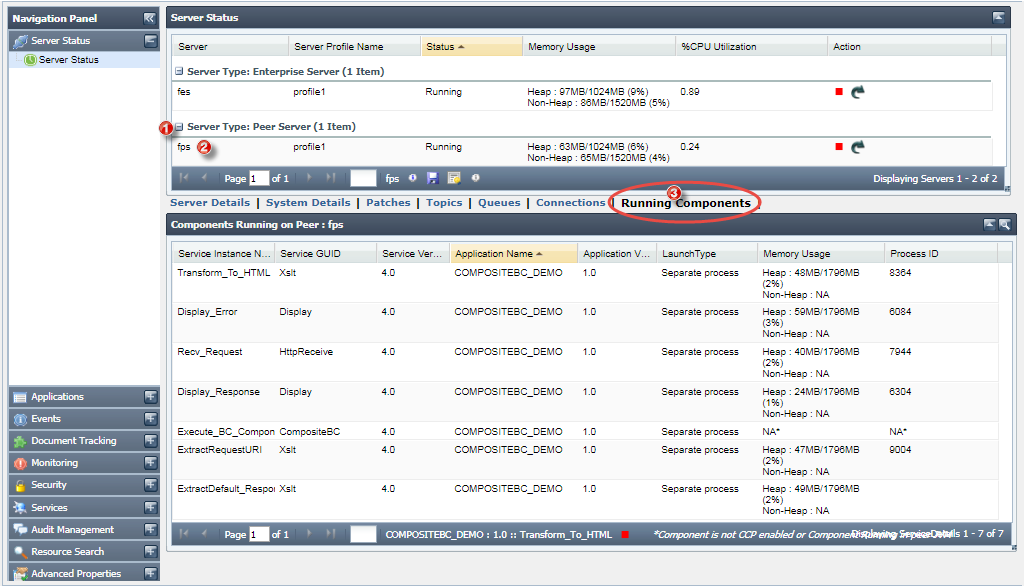
Figure 9: Running Components tab showing the microservices that are running
Applications
This section shows the details of the event processes running on the Fiorano Peer Server, helps importing applications and also to monitor performance.
Applications
The top view shows the list of event processes saved in the Fiorano Server. It also shows the details like running status, category and the Peer servers used. By clicking on the link for each event process, you get the details of the Service Instances running as part of it. This page also provides capabilities to launch, stop, restart an event process or its components, View Output and Error logs, and Export logs (These features are disabled if the event process is in Debug mode). The details for the services are displayed in the bottom view. This includes:
- Service Instance Name - Service components in the event process
- Service GUID - Service GUID of the component
- Version - Version of the component
- Status - Displays whether the component is running or not
- Running on Peer - Name of the peer server on which the component is launched
- Launch Type - Displays whether the component is launched as a separate process, in-memory or manual.
- Memory Usage - Displays memory usage for CCP enabled components
- Process ID - Displays process id for CCP enabled components which are executed as a separate process
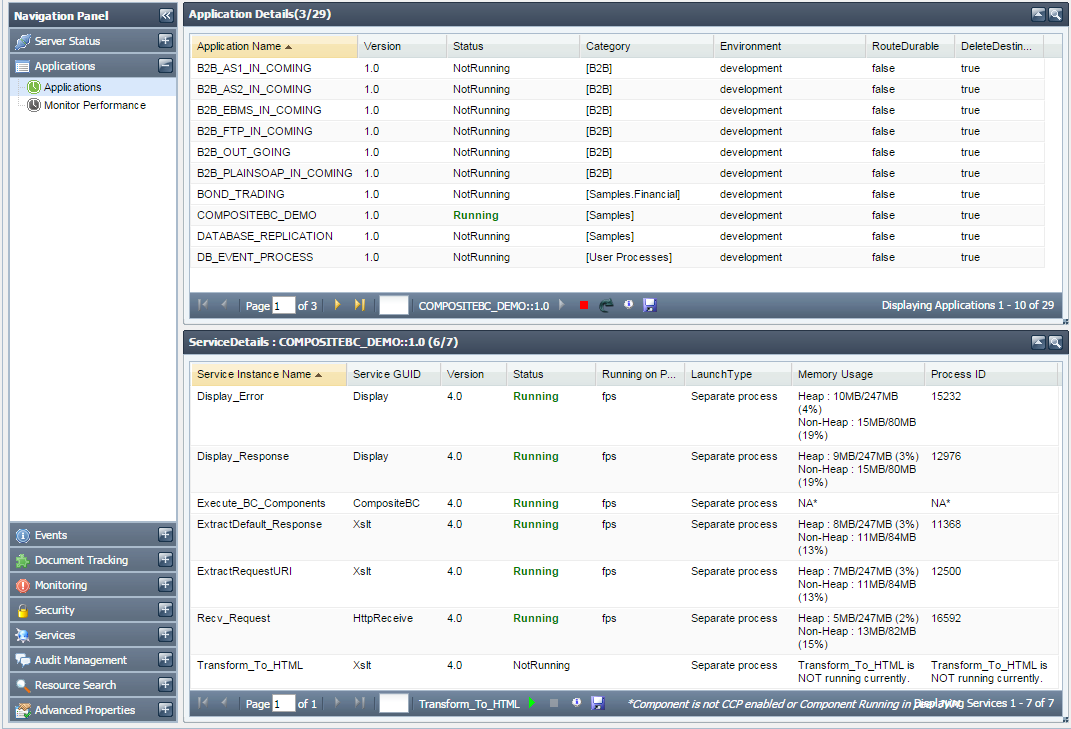
Figure 10: Applications Tab showing the details of the applications
Import Application
Import Application panel helps to import event processes which are exported or saved in a particular location. Click the Add (+) button on the upper-right part of the screen to open the panel to provide details.
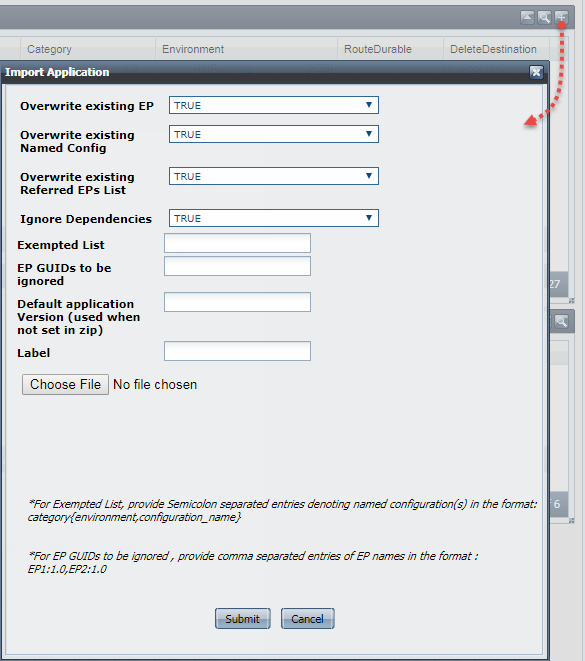
To import an event process or multiple event processes saved in a file, provide the following details, click the Choose File button to select the Zip file and click Submit.
| Property | Description |
| Overwrite existing EP |
|
| Overwrite existing Named Config |
|
| Overwrite existing Referred EPs List |
|
| Ignore Dependencies |
|
| Exempted List | Names of the named configurations to be exempted while importing. Exempted named configs should be mentioned as a comma-separated list of the following format: |
| EP GUIDs to be ignored | In a ZIP file with multiple EPs, specify the comma-separated names of the EPs that need not be imported along with the other EPs in the file. |
| Default application Version (used when not set in zip) | Specify a version number if a version number was not set in the zip file. |
| Label | Provide the environment name. Example |
Monitor Performance
You can monitor the performance of services by enabling monitoring in the respective component CPS. Performance statistics is shown in two views - Data View and Graph View.
Data View
This view shows performance messages sent by components in data form. You have the choice to select the components for which monitoring data should be displayed. Also, the time-interval for which monitoring data is displayed can be configured.
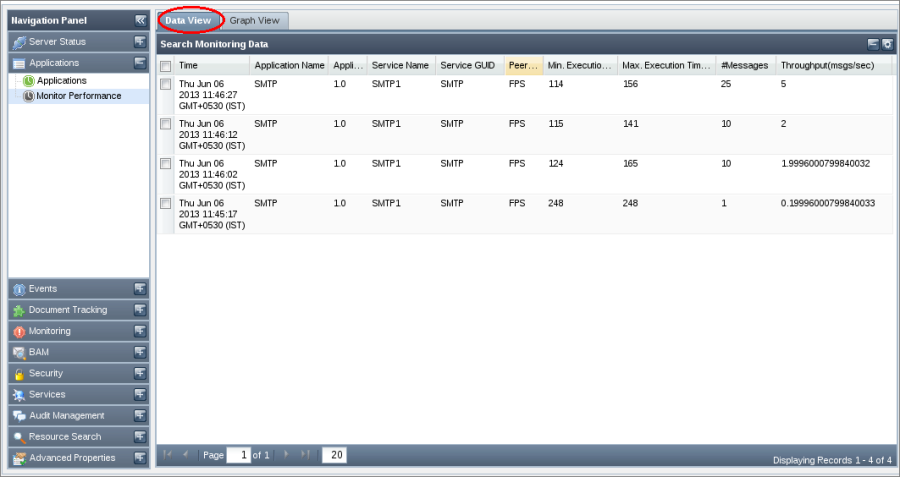
Figure 11: Data View tab
Graph View
Performance of a component is represented in a graphical form. Graphs can be monitored for archived performance data or for the latest data. To show latest performance data, select Live Graph option. Maximum number of points plotted on the graph can be configured by specifying desired value for the Max Points field. It is recommended to use Firefox 2.0 or Internet Explorer to see Graph View.
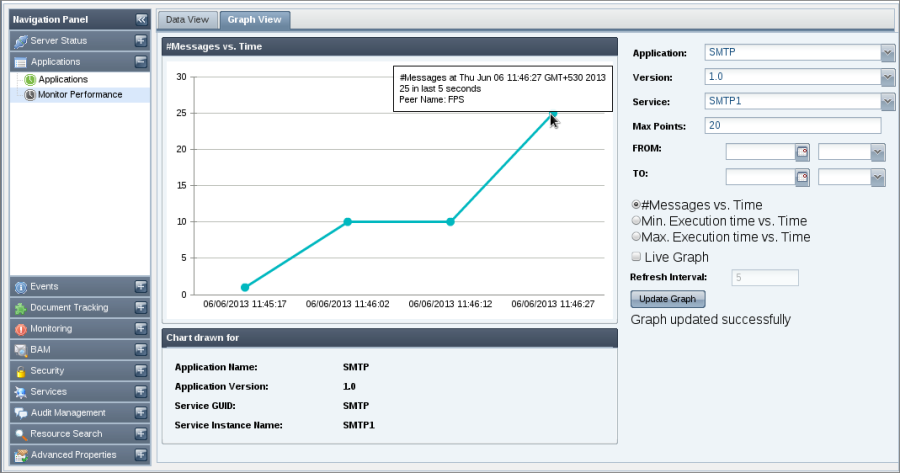
Figure 12: Graph View
Events
Provides the details of the events generated by the Fiorano Enterprise Server (FES), the Fiorano Peer Server (FPS), Applications, Services, Security, and the SBW exceptions that occur while running various event processes.
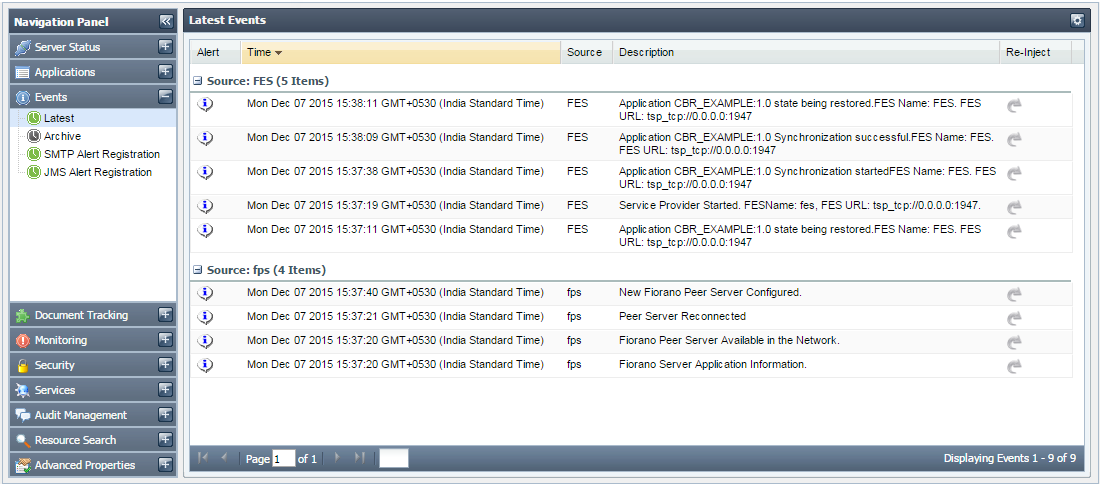
Figure 13: Events tab showing the latest events
The Event tab has four sections:
- Latest
- Archives
- SMTP Alert Registration
- JMS Alert Registration
Latest
This gives the list of latest Events generated by FES and FPS. The visible Events can be filtered using the Event Type and Event Category options. Refer to Figure 9
To open Filter Event, perform the following steps:
- Click the Events tab from the Navigation Panel and choose Latest option; a list of latest Events generated by FES and FPS is displayed.
- Click the Filter Events button present at the upper-right part of the screen; the Set Event Filters dialog box appears (Figure 10).
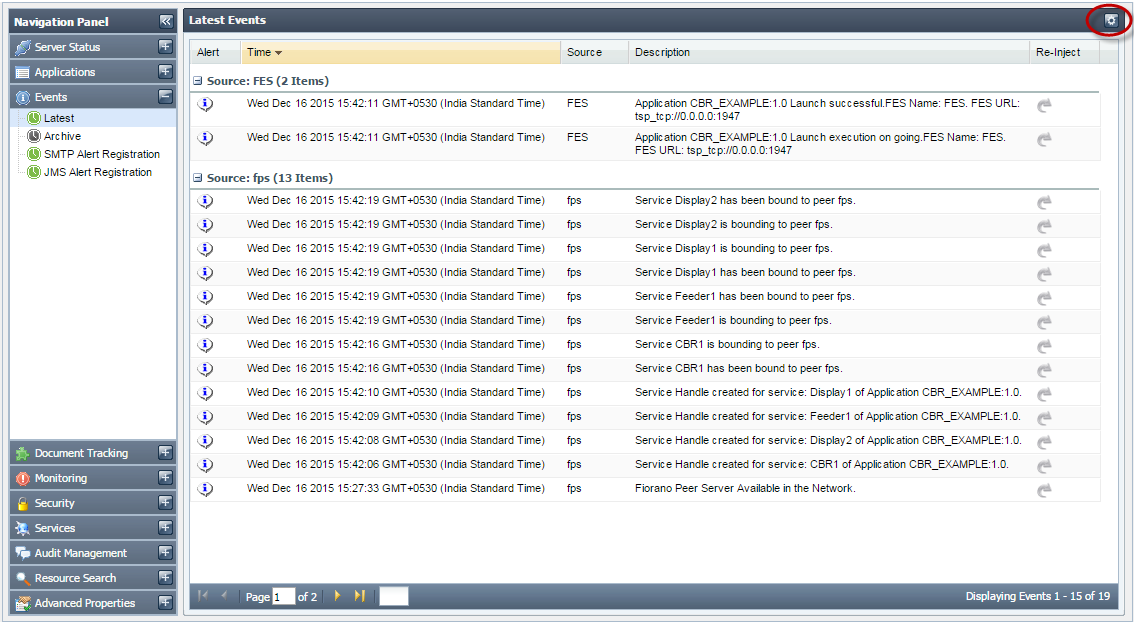
Figure 14: Filter Events Button
Choose the Event Type and Event Category from the drop-down list and click Done.
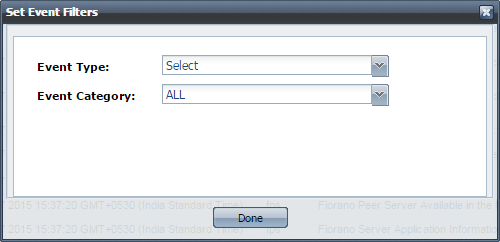
Figure 15: Set Events Filters dialog box
Archives
This section shows you Archived Events present in the database. You have the option to choose Event Type, Event Category, Date and Time range to view the corresponding Events.
To filter events, perform the following:
- Click the Events tab from the Navigation Panel and choose Archives option; a list of Archived Events is displayed.
- Click the Filter Events button present at the upper-right part of the screen; the Set Event Filters dialog box appears (Figure 12).
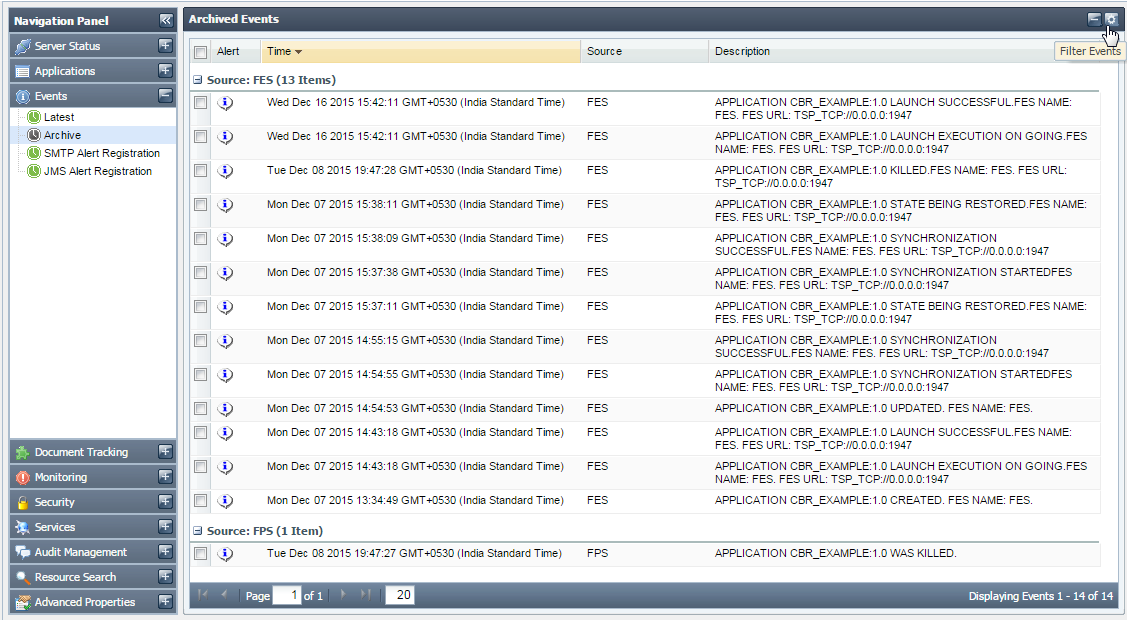
Figure 16: Filter Events button
- Choose Event Type and Event Category from the drop-down list and click the Search button, as shown in the figure below. The result appears on the screen.
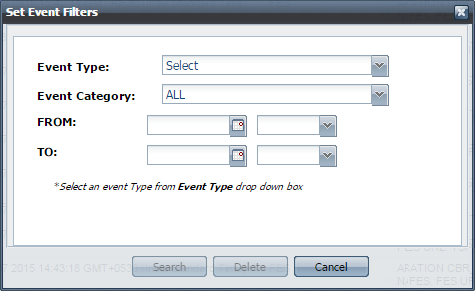
Figure 17: Set Event Filters dialog box
To delete Events, perform the following steps:
- Click the Events tab from the Navigation panel and choose the Archives option; a list of archived events appears.
- Select the relevant event and click the Delete selected records button present next to the Filter Events button.
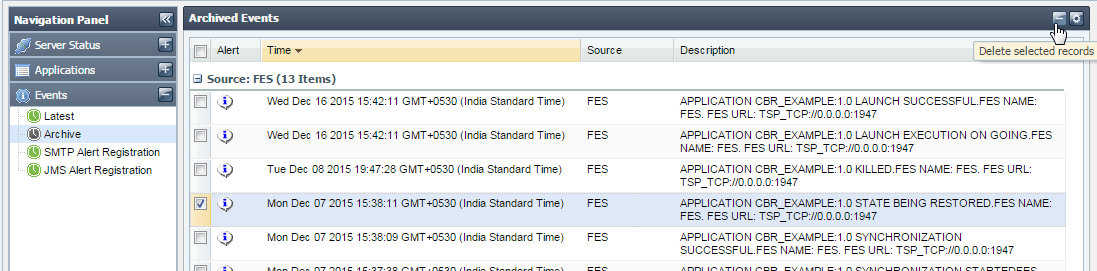
Figure 18: Delete selected records button
- The Events Table Updated dialog box appears confirming the deletion; click OK.
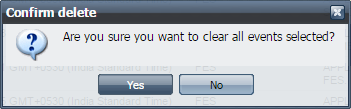
Figure 19: Event Table Updated dialog box
SMTP Alert Registration
You can change the configuration of the mail server settings by going to the Configure SMTP Server Settings button. This page also provides an option to specify usernames and passwords in case the mail server requires authentication of these in order to send e-mails.
To add an Alert Configuration, perform the following:
- Click the Events tab from the Navigation Panel and choose the SMTP Alert Registration option.
- Click the Add an Alert Configuration button; Configure SMTP Alert dialog box appears, as shown in Figure 16.
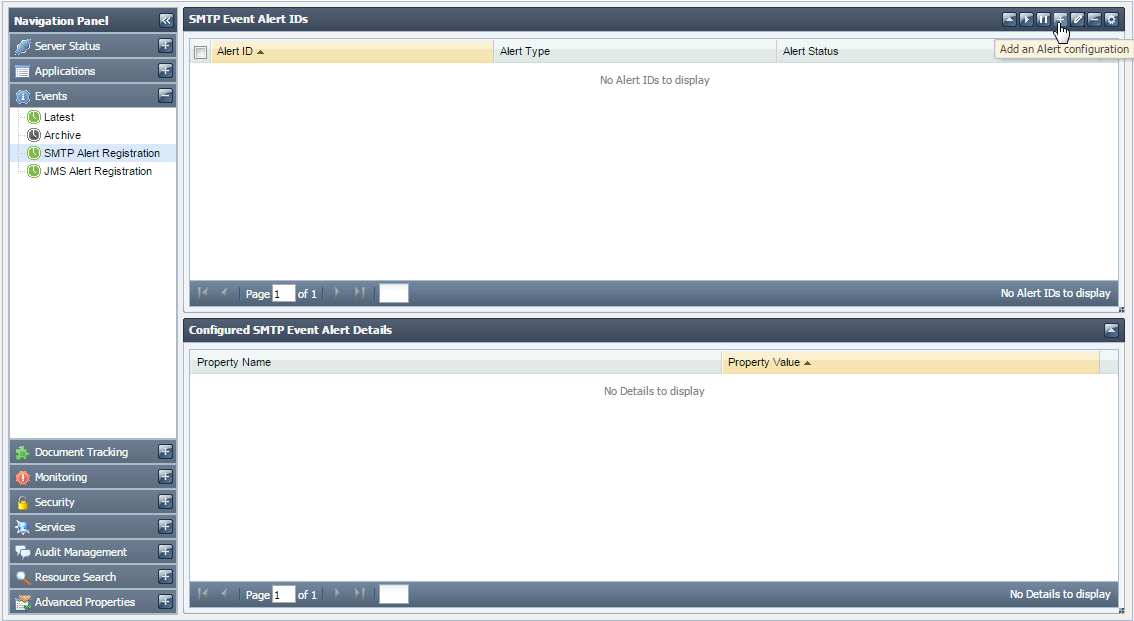
Figure 20: Add an Alert Configuration button
Choose the Event Type and Event Category from the drop-down list and enter the email ID of the recipient in RecipientAddress field.
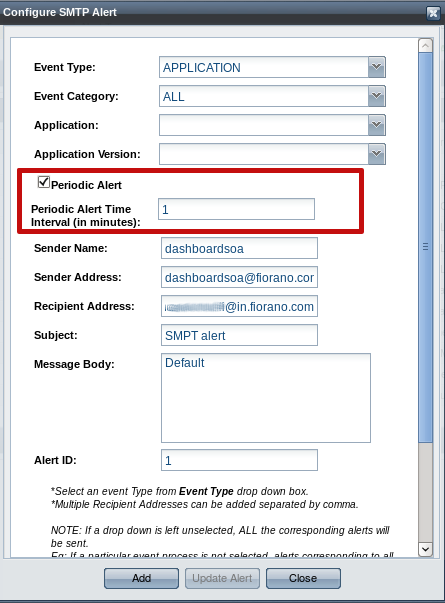
Figure 21: Configure SMTP Alert dialog box- Finally, click the Add button to apply the changes. The list of currently configured email alerts appears.
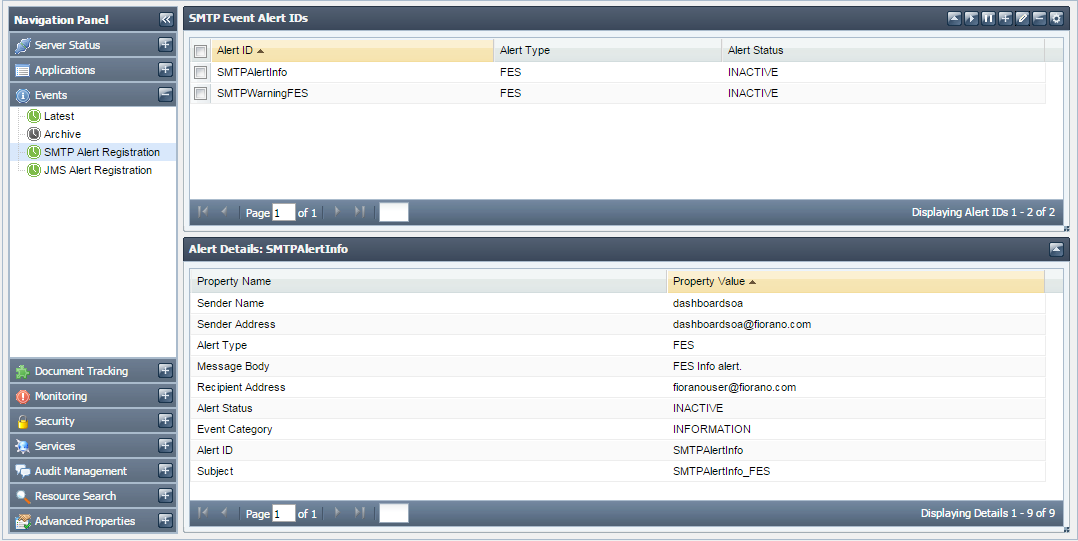
Figure 22: Event e-mail registration option
To configure SMTP server settings, perform the following:
- Click the Events tab from the Navigation Panel and choose the SMTP Alert Registration option.
- Click the Configure SMTP Server Settings button; Configure SMTP Server Settings dialog box appears as shown in Figure 18.
- Enter the details and click on Validate button, if the validation is successful, then click SaveConfigurations button to save the configurations and click Done.
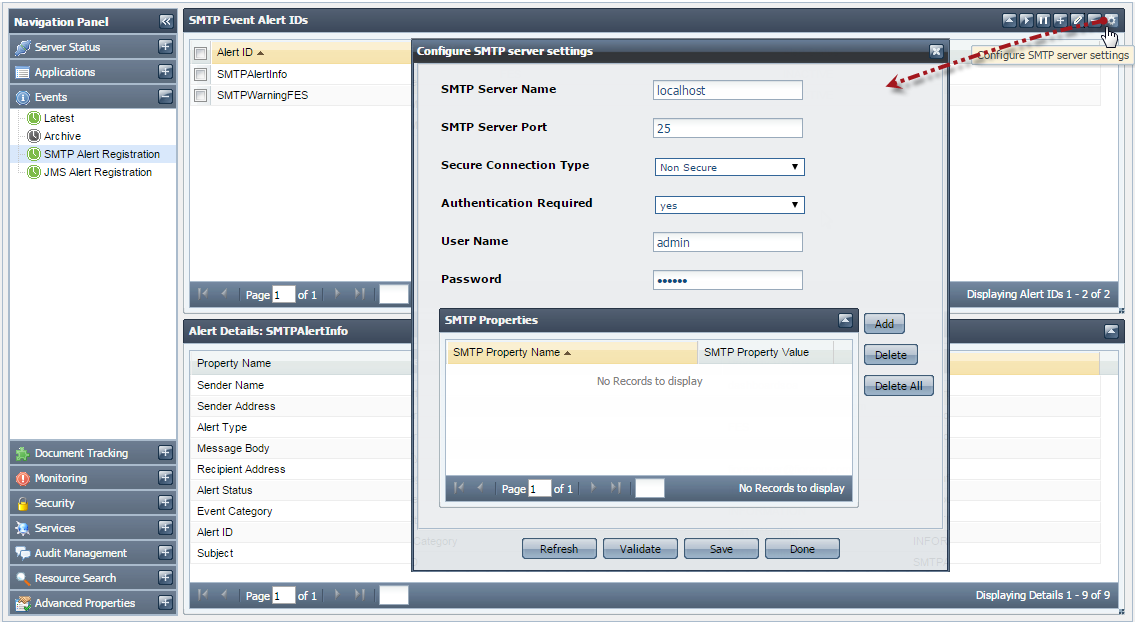
Figure 23: Configure SMTP Server Settings dialog box
JMS Alert Registration
You can configure the JMS server settings by going to the Configure JMS Server Settings button. This page also provides an option to specify usernames and passwords in case the JMS server requires authentication
To add an Alert Configuration, perform the following steps:
- Click the Events tab from the Navigation Panel and choose JMS Alert Registration option.
- Click the Add an Alert Configuration button; Configure JMS Alert dialog box appears, as shown in Figure 20.
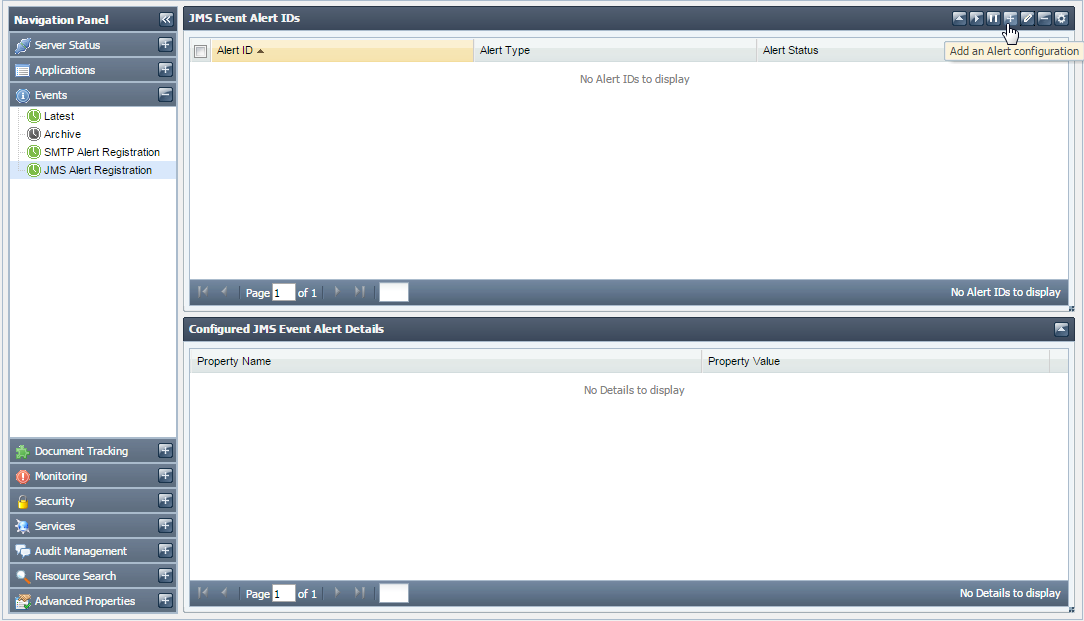
Figure 24: Add an Alert Configuration button
Choose the Event Type and Event Category from the drop-down list and enter the Destination Name(can be new or existing destination).
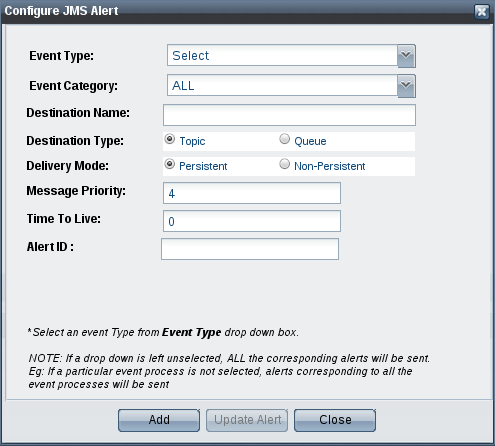
Figure 25: Configure JMS Alert dialog box- Finally, click the Add button to apply the changes. The list of JMS configured alerts appears.
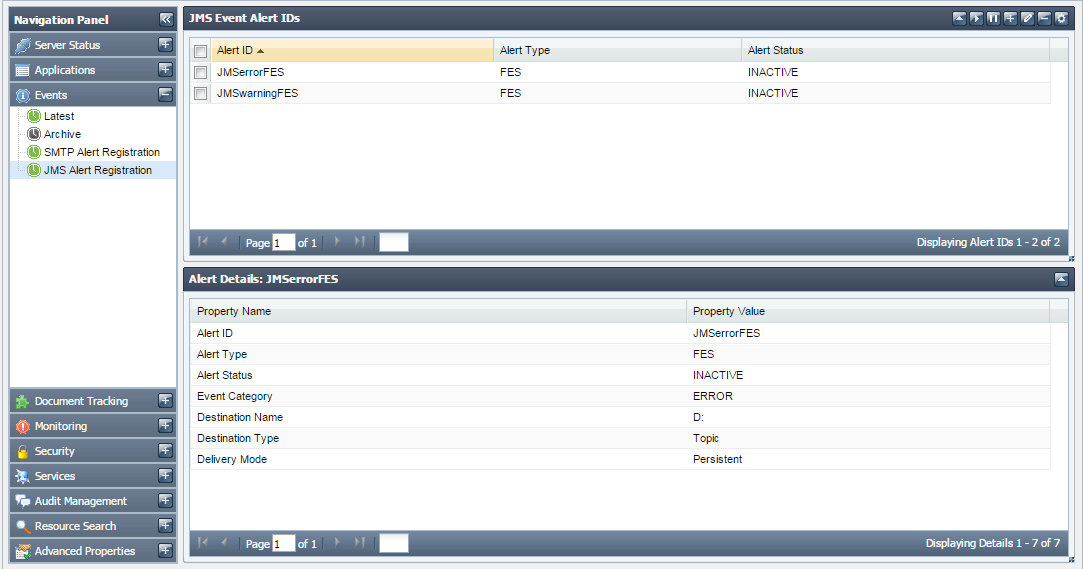
Figure 26: Event JMS registration option
To configure JMS Server settings, per
- Click the Events tab from the Navigation Panel and choose the JMS Alert Registration option.
- Click the ConfigureJMSServerSettings button; Configure JMS Server Settings dialog box appears, as shown in Figure 22.
- Enter the details and click the Validate button. If the Validation is Successful, then click Save Configurations button to save the configurations, and click Done.
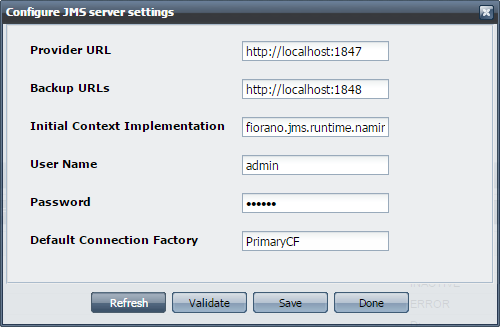
Figure 27: Configure JMS Server Settings dialog box
Document Tracking
Application Documents
This section shows all the tracked documents in Fiorano Event Processes under SBW Workflows Count section along with details of the tracked documents under SBW Documents section below.
![]()
Figure 28: Document tracking tab showing tracked documents
The details of each tracked document can be seen by clicking the particular document's Workflow ID (see the figure above). This shows the document details such as the component processing it, time stamps, document IDs and the originating port of the tracked document.
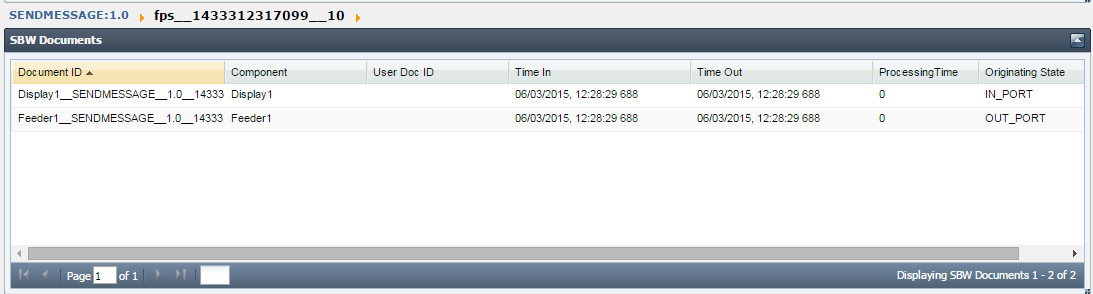
Figure 29: Details of the tracked document
Properties of the tracked documents can be seen by clicking on a particular Document ID (see the figure above), which shows the tracked document message properties, details of attachments, application context, message body and other general properties.
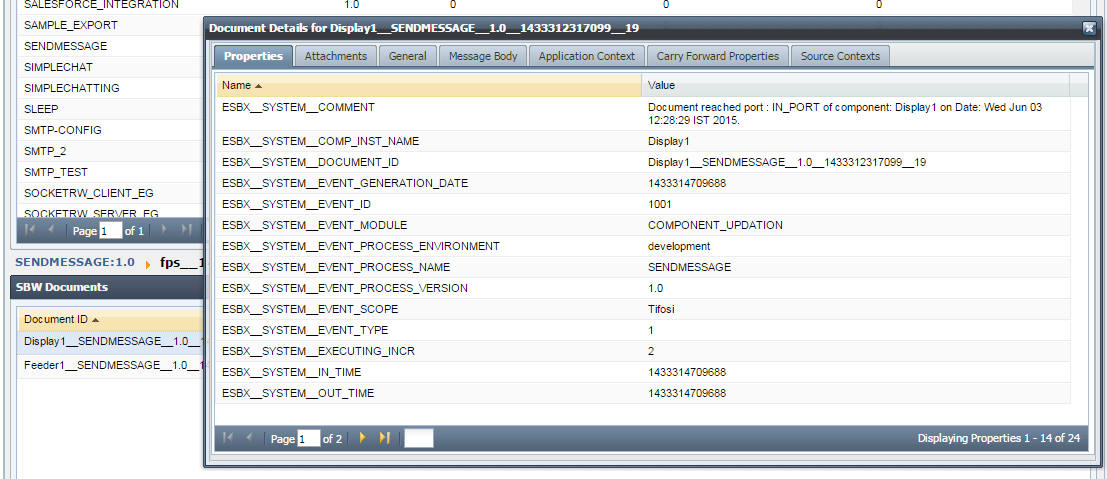
Figure 30: Tracked document
Filtering data by Date Range
Application documents data can be filtered further by specifying a particular period of time as required. Select the Date Range option to opt for specific start and end dates in the DD/MM/YYYY HH:MM:SS format to filter records, and select from the options Hour, Today, Week, Month, and Year for the latest hourly, daily, weekly, monthly and yearly data respectively.
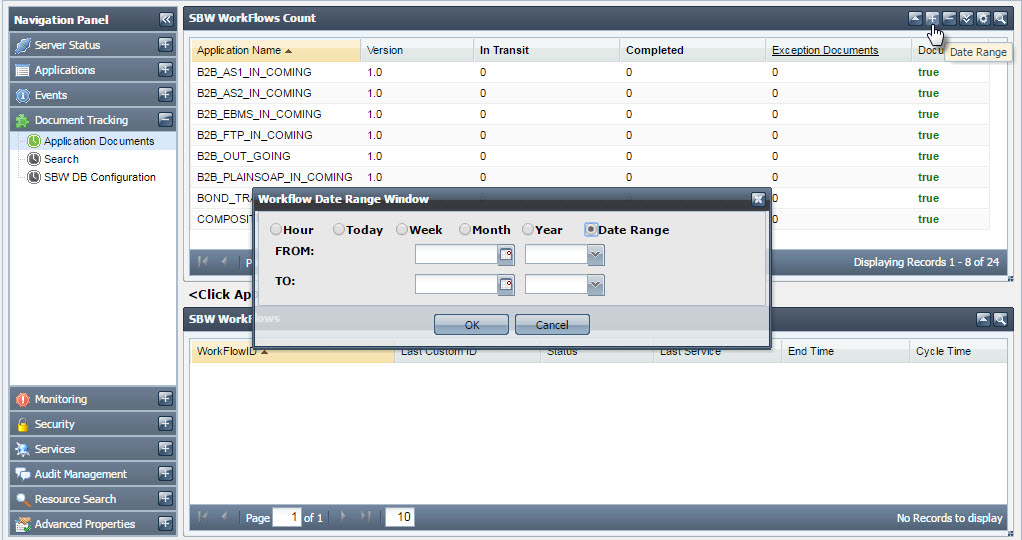
Figure 31: Option to filter data using Date Range
Application Level Document Tracking
You can Enable/Disable Document Tracking at Application Level by clicking the Enable/Disable Application Level Document Tracking button present at the upper-right side of the screen. Select the Application and Version for which document tracking has to be enabled/disabled and click Enable'/'Disable.
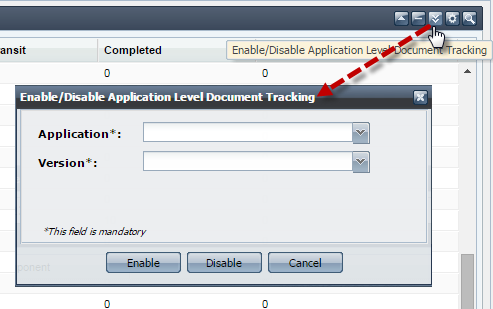
Figure 32: Application Level Document Tracking
Reset Counters
You can reset the counters of Workflows and Exception Documents as visible in the Application Documents tab. The reset action can also be undone later. Click the Reset Counters button present at the upper-right side of the screen to open Reset Counters dialog box. Select the Application and Version for which document tracking has to be reset and click Submit. The counters to be reset can be selected by selecting the appropriate checkbox, options being In Transit, Completed, Exception Documents and Undo Reset.
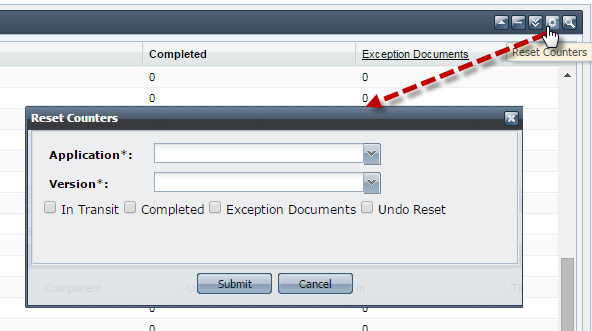
Figure 33: Reset Counters
Search
Searching Tracked Documents
The Dashboard supports searching of tracked documents based on various criteria such as Application Name, Version, Service, Port Name, User DOC ID, Workflow Instance ID, Document ID, FPS Name, Status. Document Status (EXECUTED or EXECUTING) and Message. In addition, documents can be searched based on their date they were generated (the results can be produced in Ascending/Descending order as well). To provide the search options, click Search section and then click the Filter SBW Documents button present at the upper-right part of the screen.
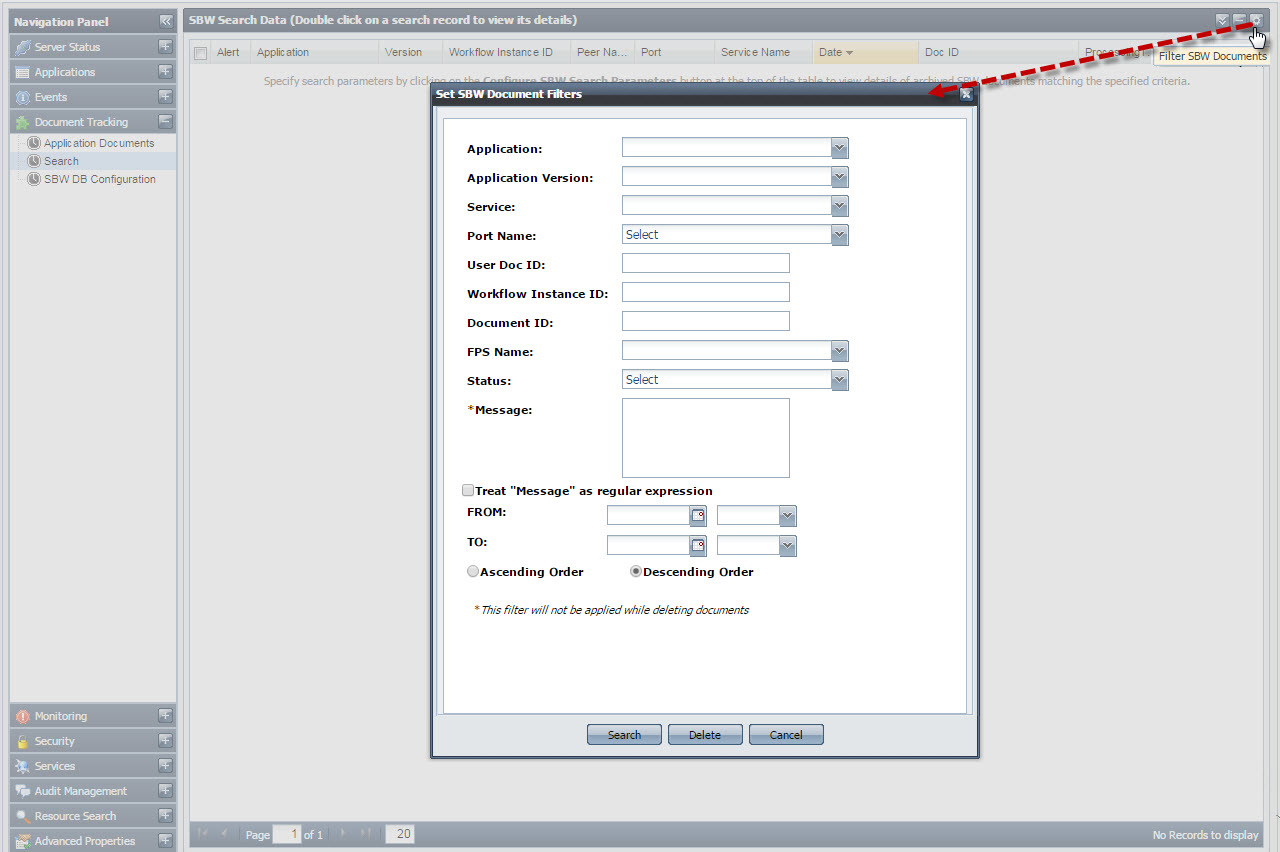
Figure 34: Searching tracked documents
Re-injecting Documents
Documents can be selected as per choice and re-injected using the ReInject Selected Documents button present in the upper-right part of the screen. This is mainly used to re-inject failed documents, that is, the messages that reach the exception port.
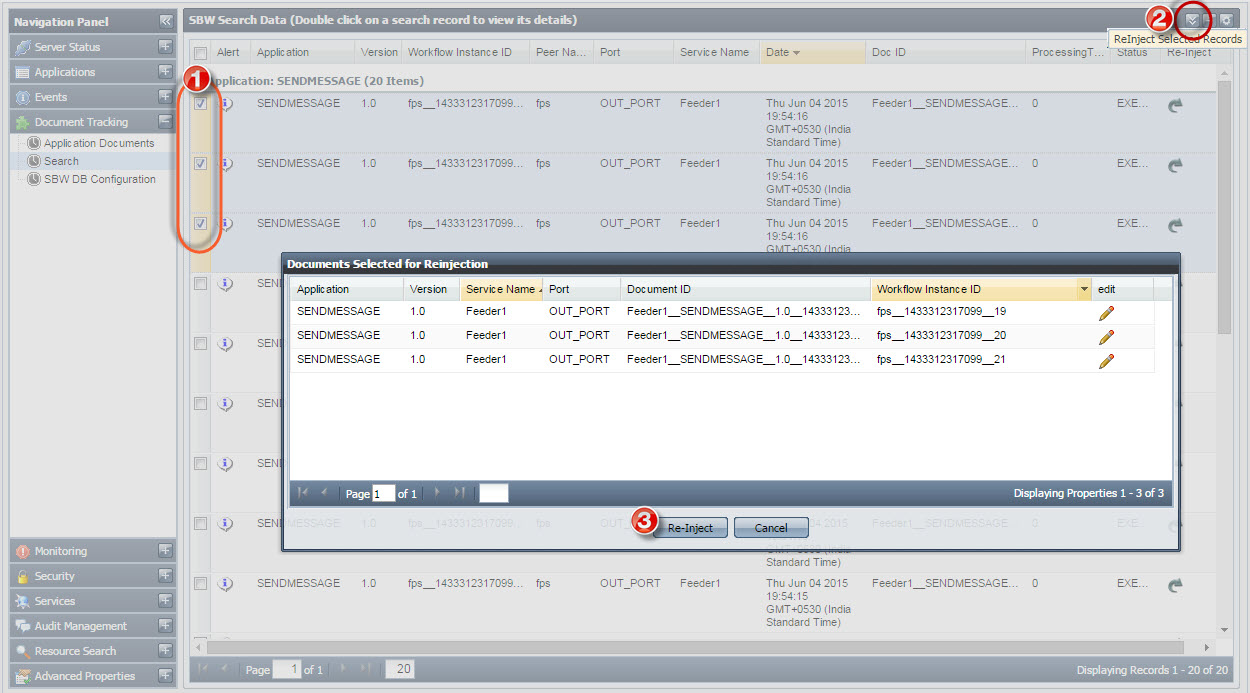
Figure 35: Selecting documents to reinject
Deleting Selected Documents
To delete a document or a selected set of documents, select the record(s) and click Delete Selected Documents button present in the upper-right part of the screen.
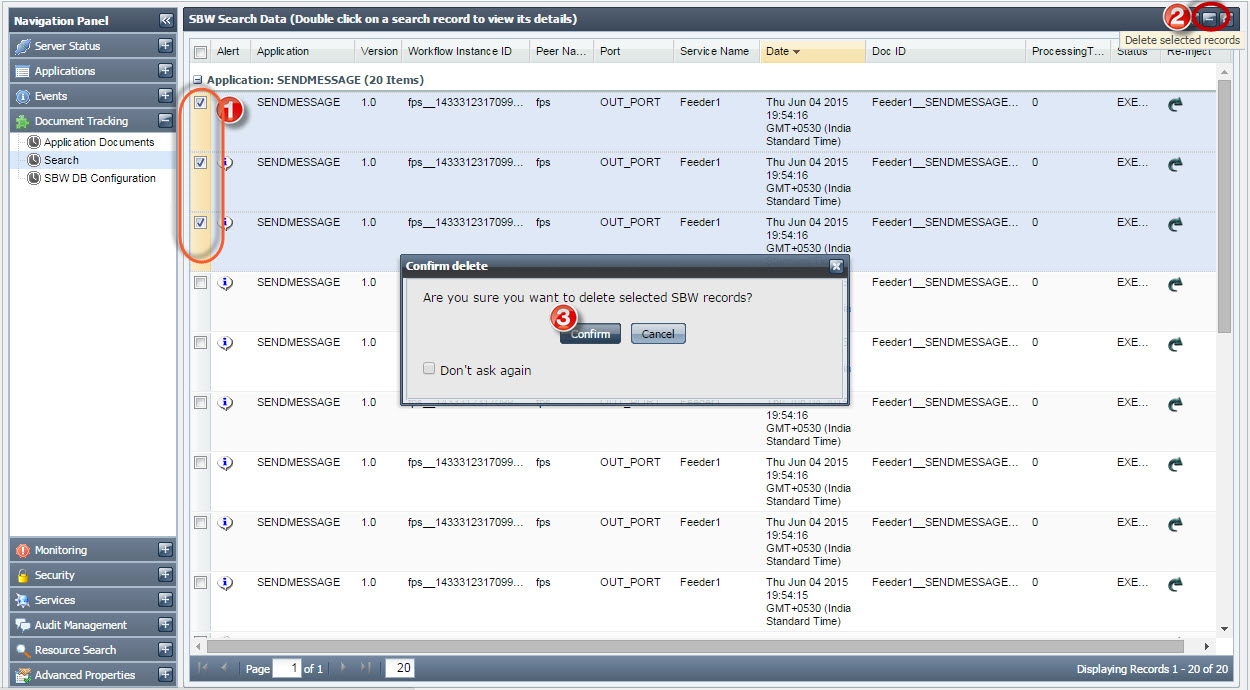
Figure 36: Selecting documents to delete SBW records
SBW DB Configuration
SBW DB configuration can be defined in the SBW DB table instead of hardcoding the sbwdb.cfg file present at installer\esb\server\profiles\server1\FES\conf.
After providing values, click the Save Configurations button to apply the changes made.
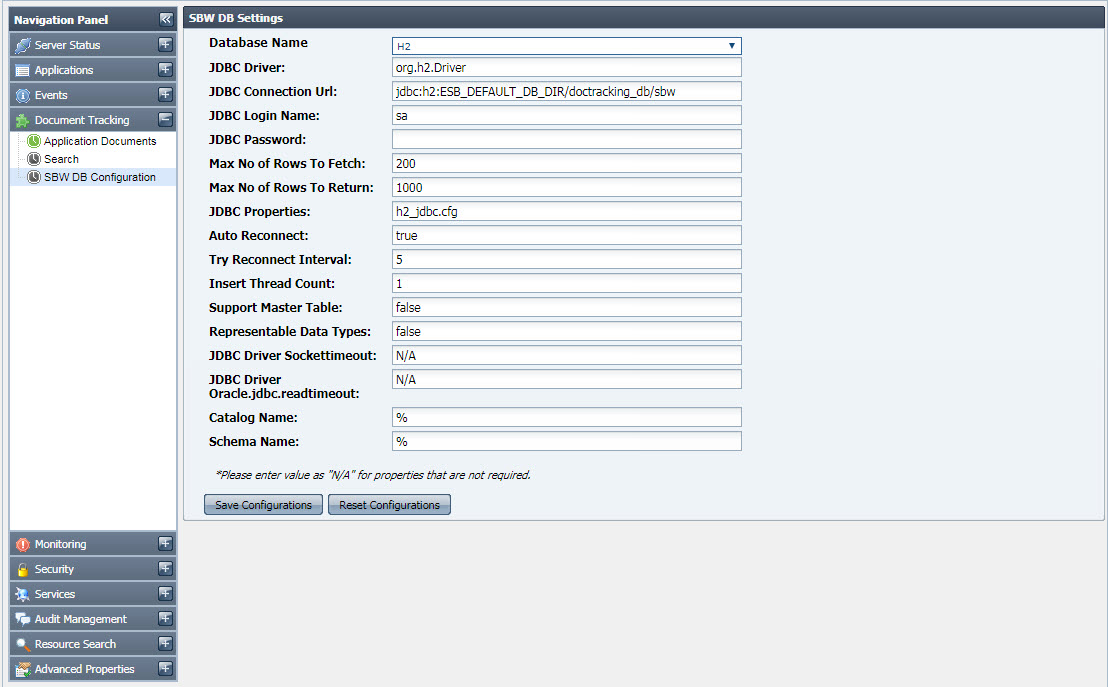
Figure 37: SBW DB Configuration panel
Scheduling Deletion of SBW Documents
To understand how to schedule a deletion task for old SBW documents and thereby create some disk space, refer How to schedule Deletion of SBW Documents section. This helps in avoiding issues like Low Disk Space error.
Monitoring
The monitoring section helps you add policies or alerts to monitor the Fiorano Network.
The Monitoring tab has the following sections:
- Monitor Messages
- Policy Manager
- Alert Manager
Monitor Messages
Policy Manager
This tab shows all the policies that are present in the Fiorano Network. This tab allows you to add new policies, edit or delete an existing policy, apply or suspend existing policies.
Two types of policies can be added:
- Backlog Policy
- Low Memory Policy
- Low Disk Policy
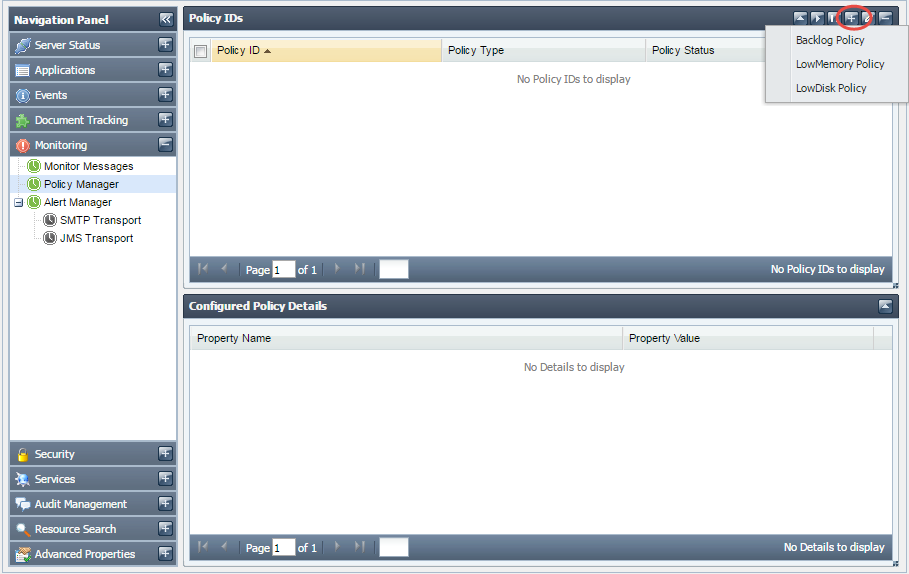
Figure 38: Policy Manager
Alert Manager
This tab shows all the alerts that are present in the Fiorano Network. This tab allows you to add new alerts, edit or delete an existing alert.
Two types of alerts can be added:
- SMTP Alert
- JMS Alert
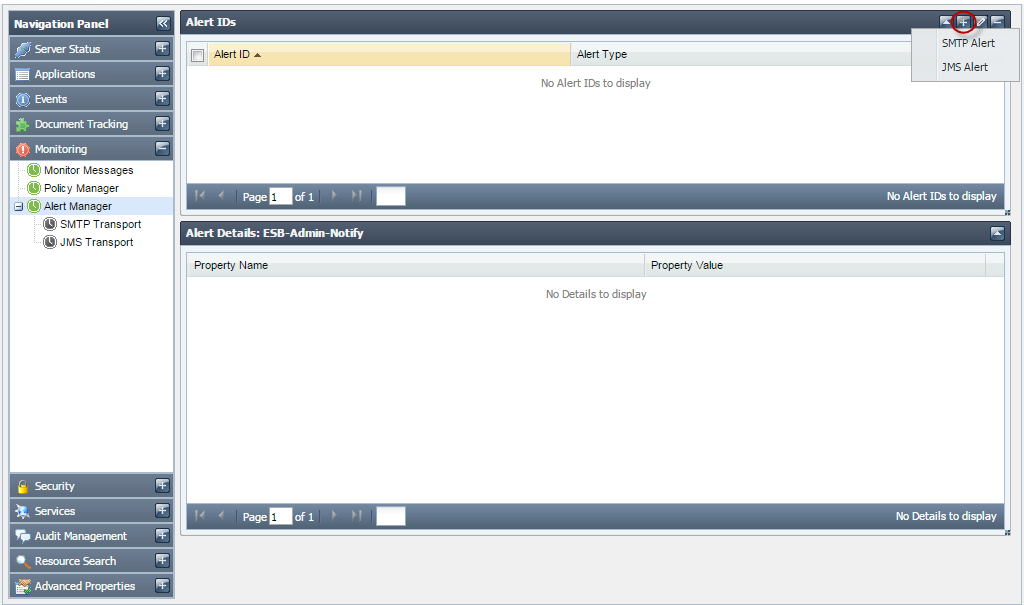
Figure 39: Alert Manager
This tab has two sub-tabs. These allow to specify the transport settings that will be used for sending the alerts. The settings can be specified for SMTP and JMS transports.
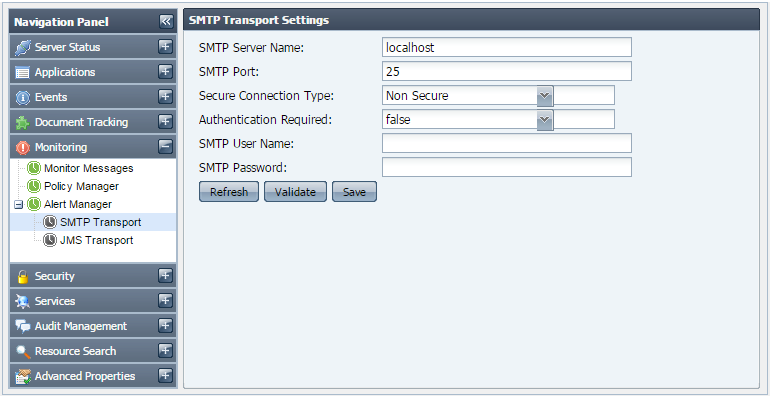
Figure 40: SMTP Transport
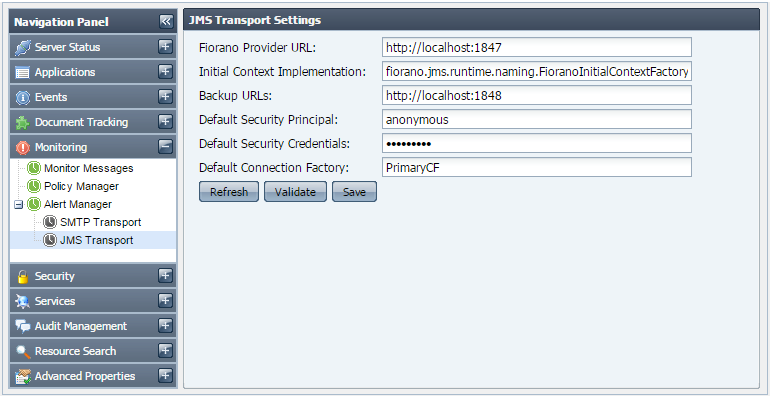
Figure 41: JMS Transport
Security
Security section gives the security actions that can be performed in the Fiorano Network. These include adding/ editing users, groups, application level or group level permissions and validation or strength rules for passwords. These also include the principal store synchronization.formed in the Fiorano Network. These include adding/ editing users, groups, application level or group level permissions and validation or strength rules for passwords. These also include the principal store synchronization.formed in the Fiorano Network. These include adding/ editing users, groups, application level or group level permissions and validation or strength rules for passwords. These also include the principal store synchronization.formed in the Fiorano Network. These include adding/ editing users, groups, application level or group level permissions and validation or strength rules for passwords. These also include the principal store synchronization.
The Security tab has seven sections:
- Users
- Groups
- Global Permissions
- Application Permissions
- Principal Store Sync
- Security Datastore Reset
- Password Rules
- Certificate Management
Users
This tab shows you details of Users currently registered in the Fiorano network. The actions that can be undertaken in this tab include creating new users, deleting an existing user or changing password for an existing user, provided that you have the proper User Permissions to do so.
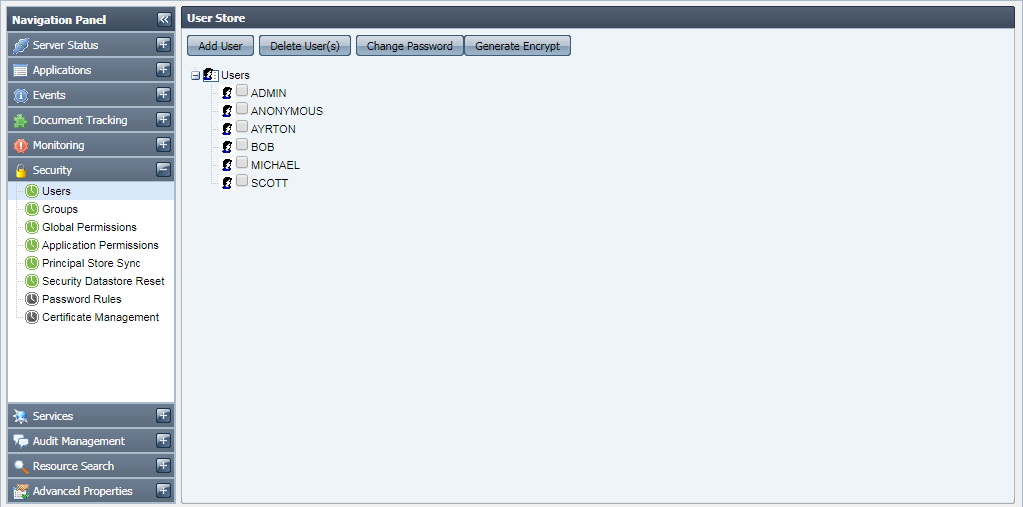
Figure 42: Users
Groups
This tab shows the groups registered in the Fiorano network. Groups allow grouping users together and applying actions on them together. The actions that can be undertaken in this tab include creating new groups, deleting/editing an existing group, provided that you have proper User Permissions to do so.
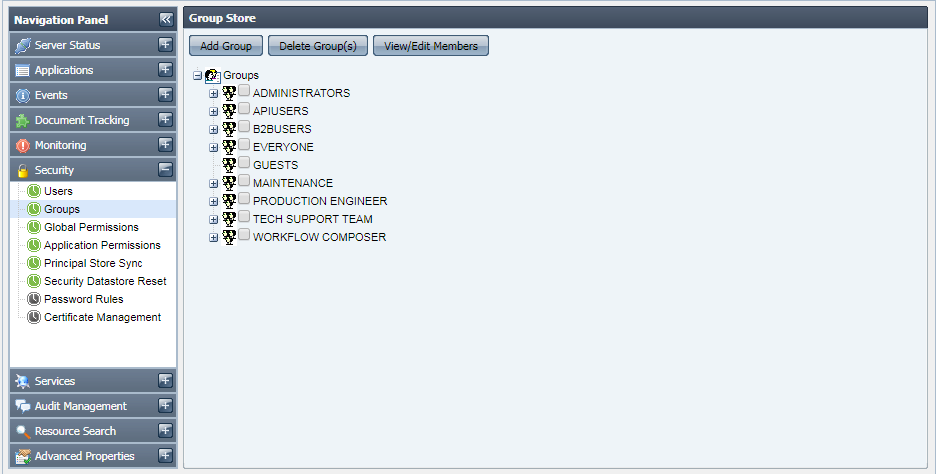
Figure 43: Groups
Global Permissions
This tab shows the global permissions that are currently available in the Fiorano network. This tab allows you to edit or specify the users for whom these permissions will be applicable, provided that you have proper User Permissions to do so.
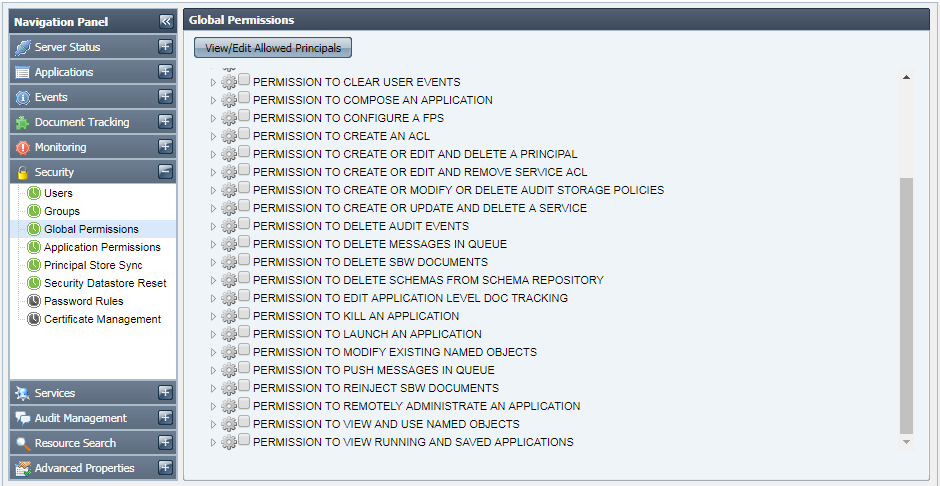
Figure 44: Global Permissions
Application Permissions
This tab shows the application permissions that are available in the Fiorano network. This tab allows you to edit the application permissions for a user, provided that you have proper User Permissions to do so.
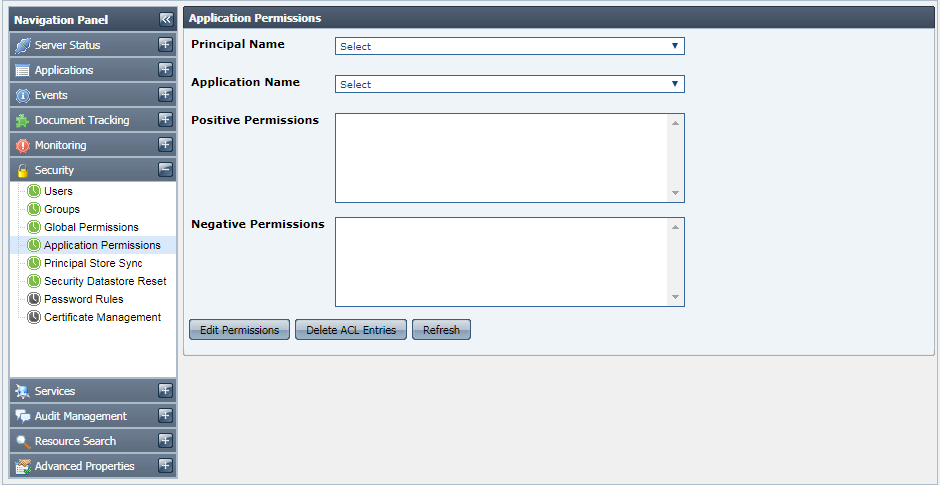
Figure 45: Application Permissions
Principal Store Sync
This tab shows the principal store synchronization status for the connected peers. This also allows you to synchronize the store for a peer.
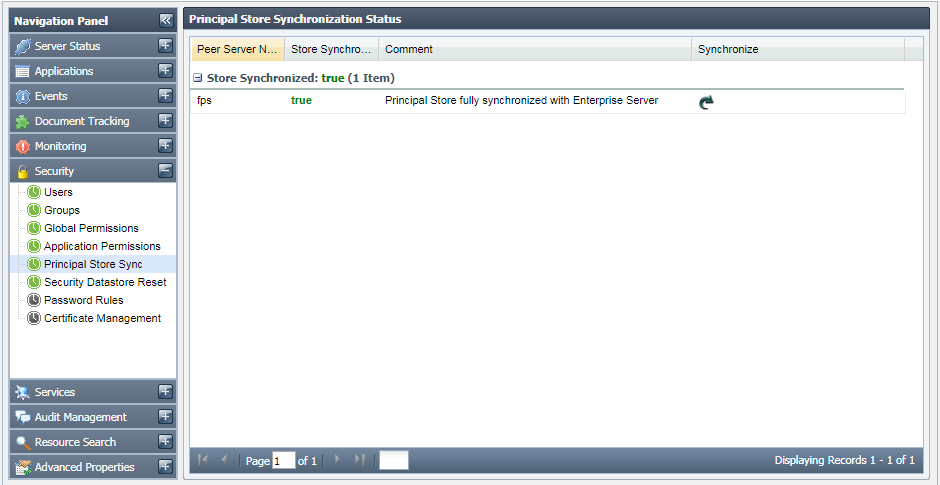
Figure 46: Principal Store Sync
Security Datastore Reset
This tab shows the Security Datastore of the Enterprise Network. It also allows the authorized user to reset the entire Security Datastore viz. the Principals and the ACLs to system default.
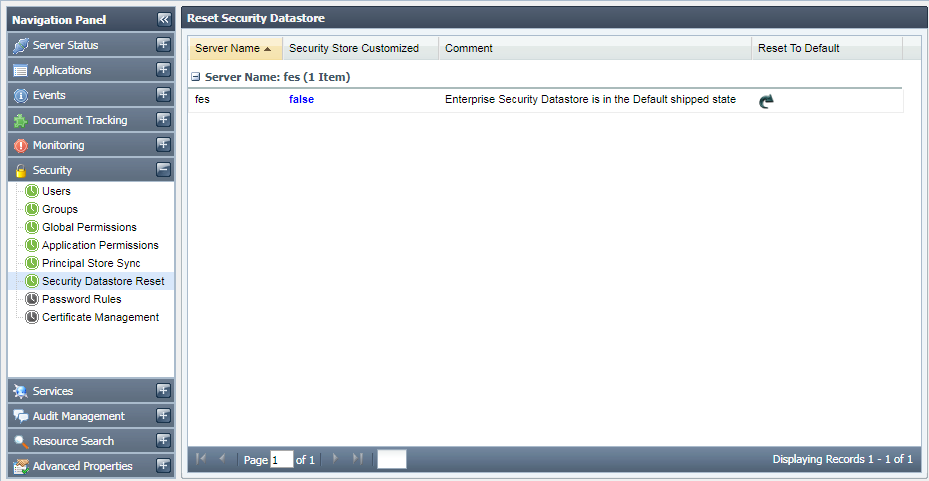
Figure 47: Security Datastore Reset
Password Rules
This tab shows the validation and strength rules that are used for matching the passwords or determining their strengths. This tab allows you to add new rules or remove an existing one. By default, no validation rules are provided.
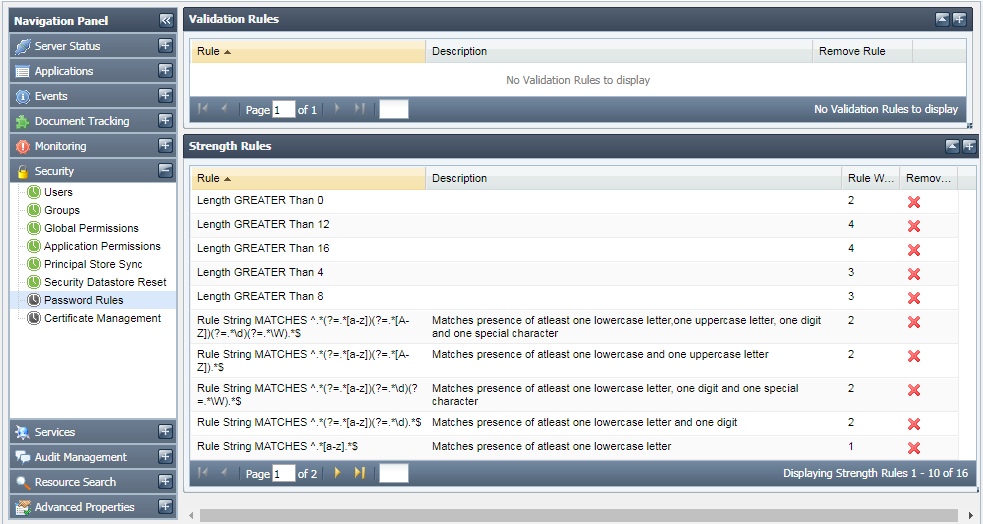
Figure 48: Password Rules
Certificate Management
This feature shows the list of keys of the server's trust store. This also allows to add or remove keys to server's trust store.
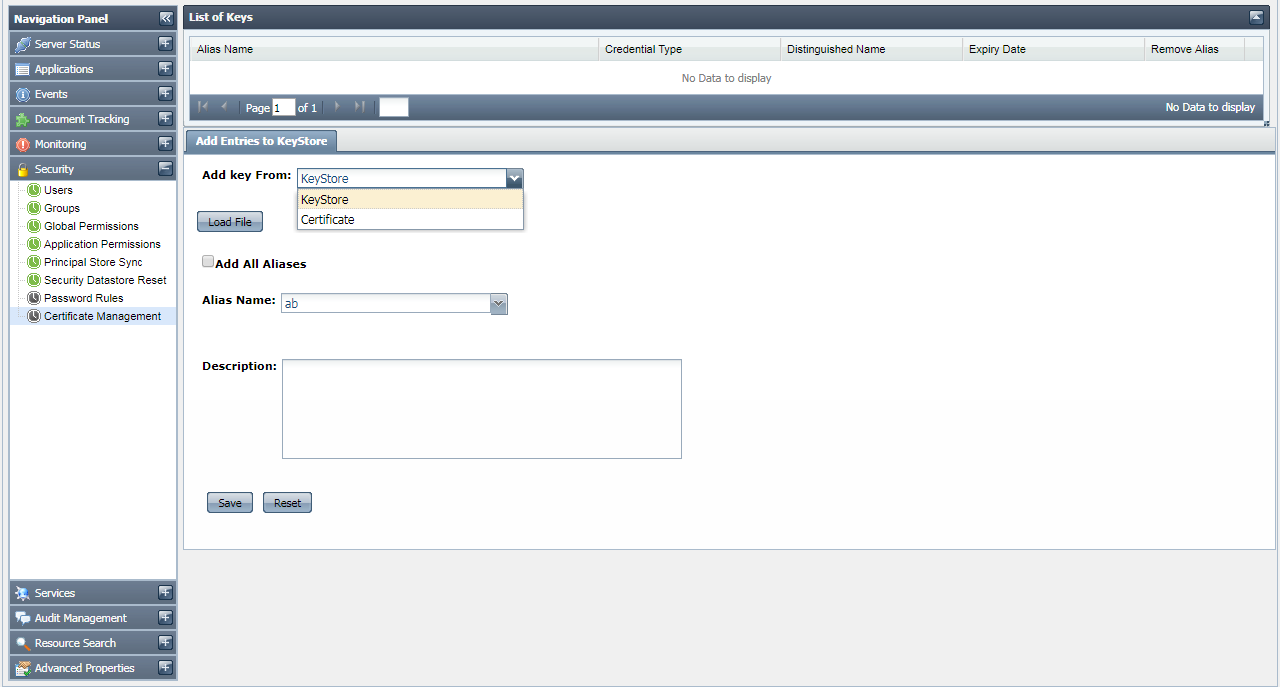
Figure 49: Certificate Management options
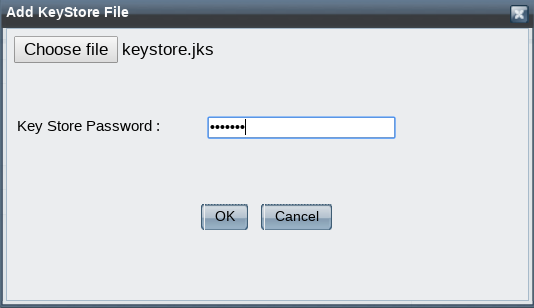
In the Add Entries to keystore tab, select "keystore" from Add key Fromdrop-drown menu and click the Load File button to load keystore.
- Select the key from Alias Name drop-down and click the Save button to apply the changes. After successful save, keys get displayed in the key under List of Keys tab.
- To remove keys from trust store, click the Delete
 button in the Remove Alias column.
To add Keys from certificates,
- Select "Certificate" from the Add key From drop-drown menu.
- Using the Load File button, choose the certificate file.
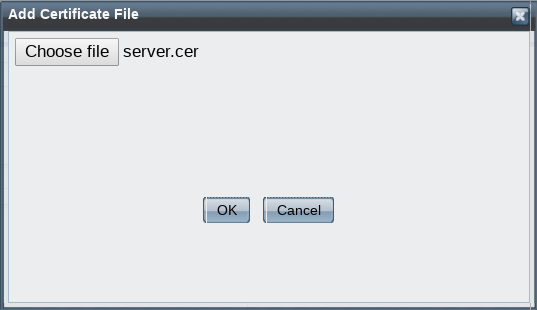
Figure 51: "Add Certificate File" dialog box to add Keys from certificates - Provide the alias name and description and click on Save button.
Services
The Services tab shows the details of the event processes deployed as Web Services. You can view the status of web service either online or offline and has the option of enabling or disabling this option. You can also test RESTful deployed from the dashboard.
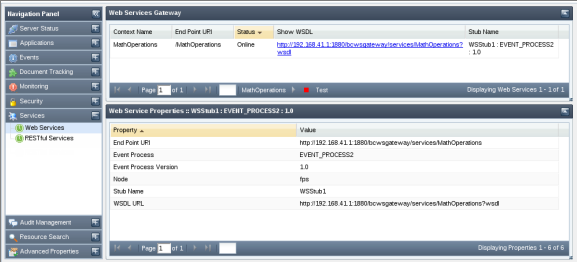
Figure 52: Web Services - Event process
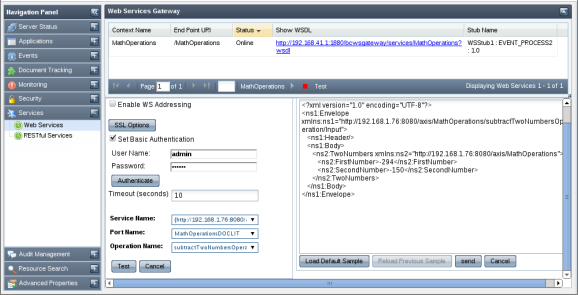
Figure 53: Web Services tab
The details shown for the Event Process deployed as web services are:
- Context Name - Name of the context for the web service deployed
- End Point URL - Effective End Point URL is http://<peerserverip>:<httpport>/<rootContext>/ContextName
- Status - Shows whether the web service is online or offline
- Show WSDL - Gives the link to show WSDL
- Stub Name - Name of Stub for the deployed Event Process as web service
Audit Management
Audit Management section in web console allows defining audit policies and searching for audit events as per requirement. This section has been divided into 3 sub-sections.
- Policies
- Event Viewer
- Audit Policy Store Synchronization
Policies
In this view, you can view/edit available audit policies. These policies define the actions that will be audited by the system. In a fresh installation, all policies are in passive state, meaning none of the action is audited. You can selectively enable the actions that they want to audit.
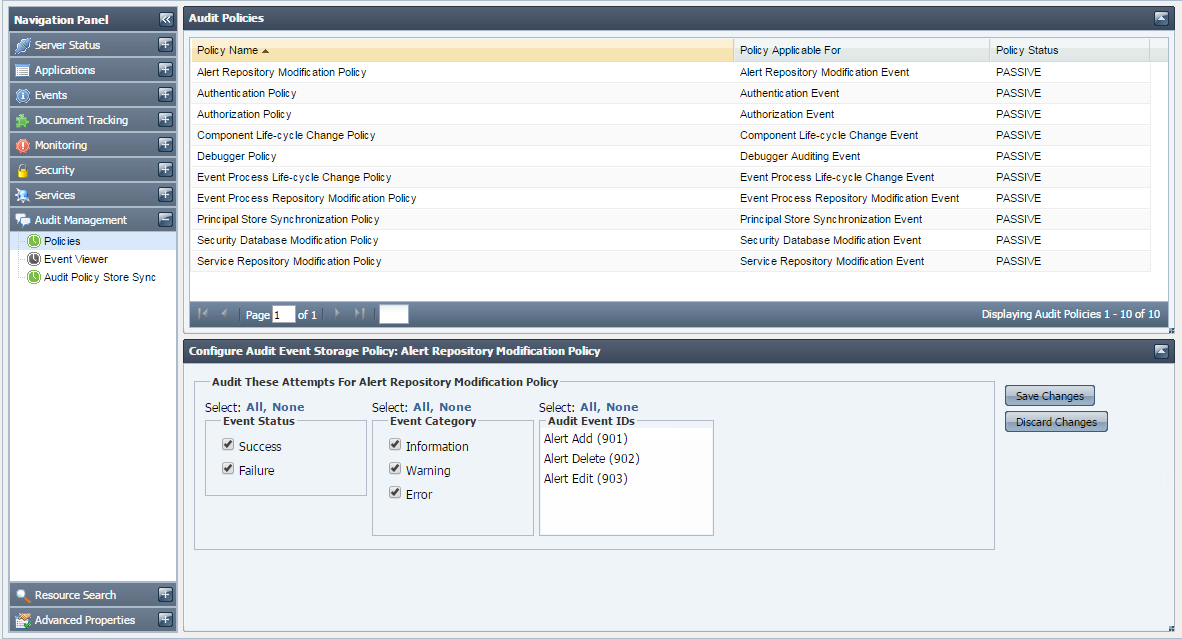
Figure 54: Policies
Event Viewer
This view shows audit events based on the specified search criteria. A comprehensive list of audit event filters is available to refine the audit events as per requirement. This view also allows saving search preferences for later use, thus avoiding the painful task of creating audit filters each time you need to search. Below is a snapshot of Event Viewer page rendered after searching for certain audit events.
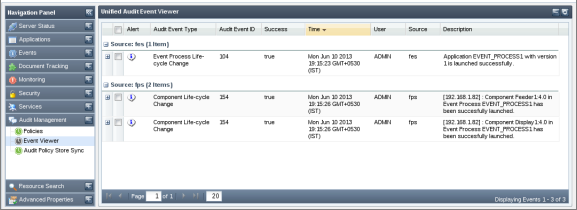
Figure 55: Event Viewer
Audit Policy Store Synchronization
This view shows the result of synchronization of audit policy store operation (See image below). A synchronized audit policy store means that the same audit policies (as in Enterprise Server) are active in peer servers as well. If stores are not synchronized, the status field will display 'false' and the reason for which the synchronization not achieved will be displayed under Comment column. You can force re-synchronization of audit policies with a particular peer server by clicking on the image shown under 'Synchronize' column.
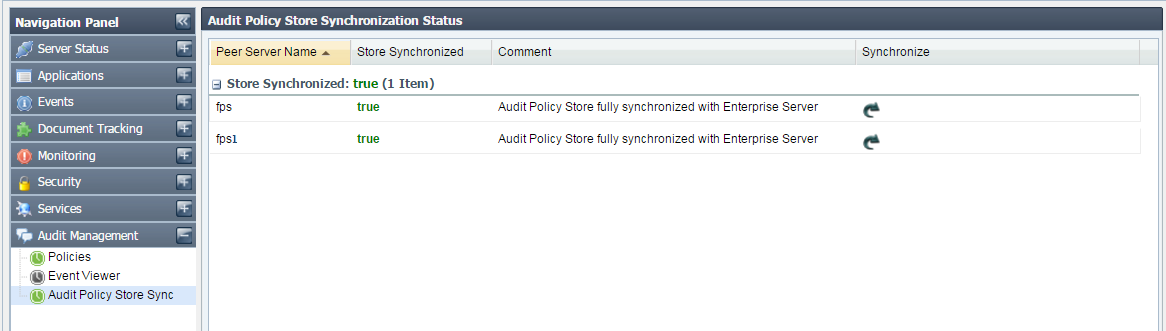
Figure 56: Audit Policy Store Synchronization
Resource Search
This section allows you to search for different resources that have been configured to be used by Fiorano Event Processes. The search for the resources can be performed on three different views:
- Application View
- Component View
- Resource View
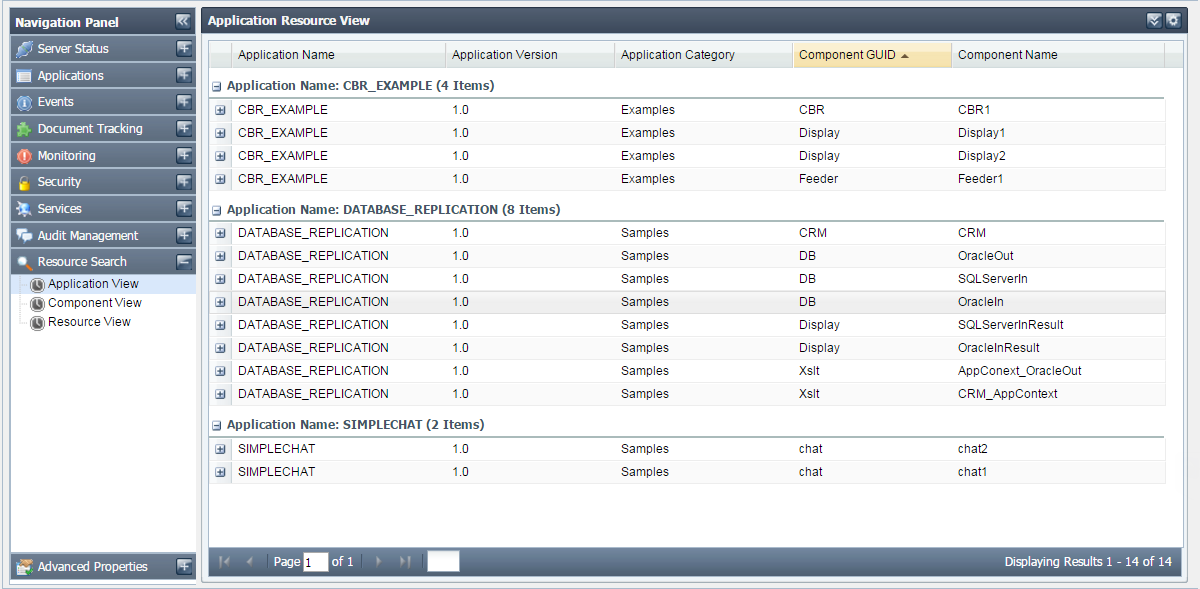
Figure 57: Searching configured resources based on application view
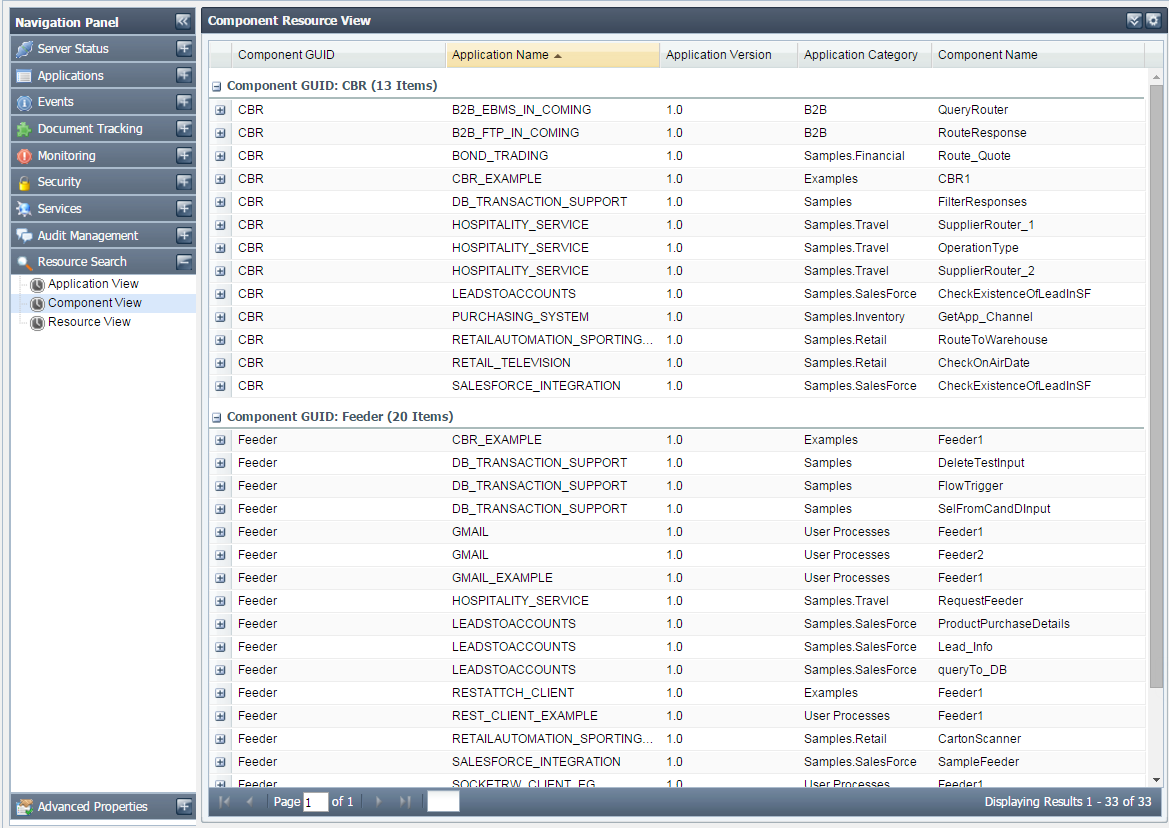
Figure 58: Searching configured resources based on component view
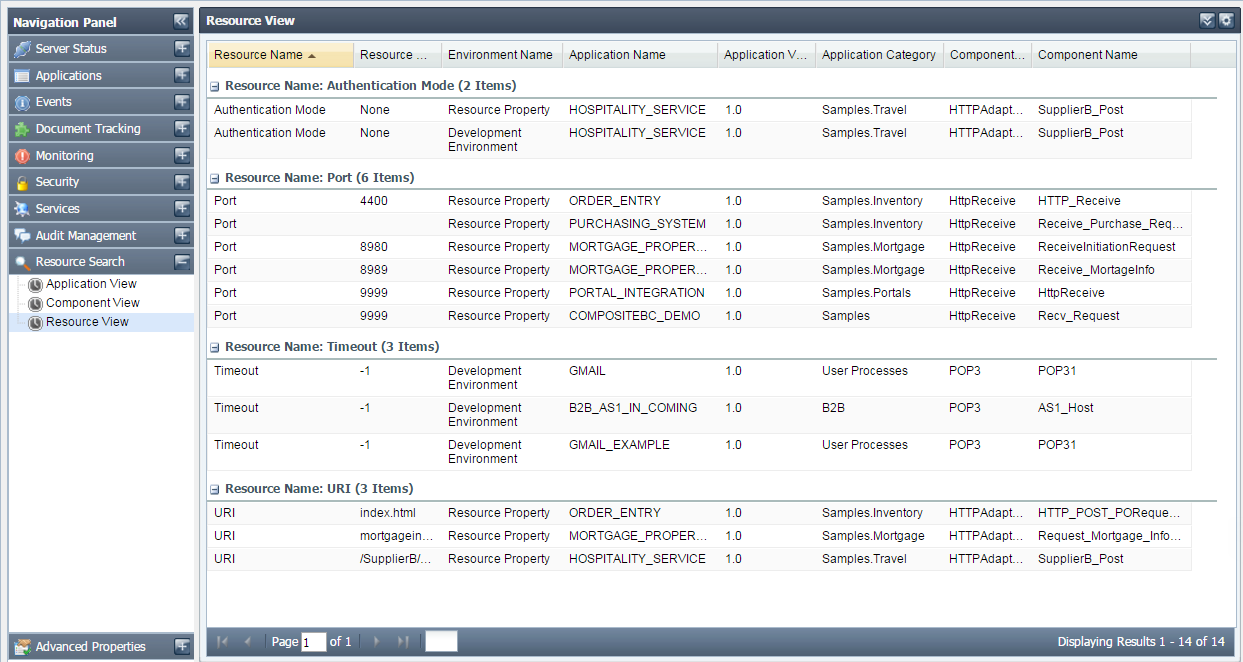
Figure 59: Searching configured resources based on resource view
Advanced Properties
This tab allows you to change values of frequently used server properties from Dashboard.
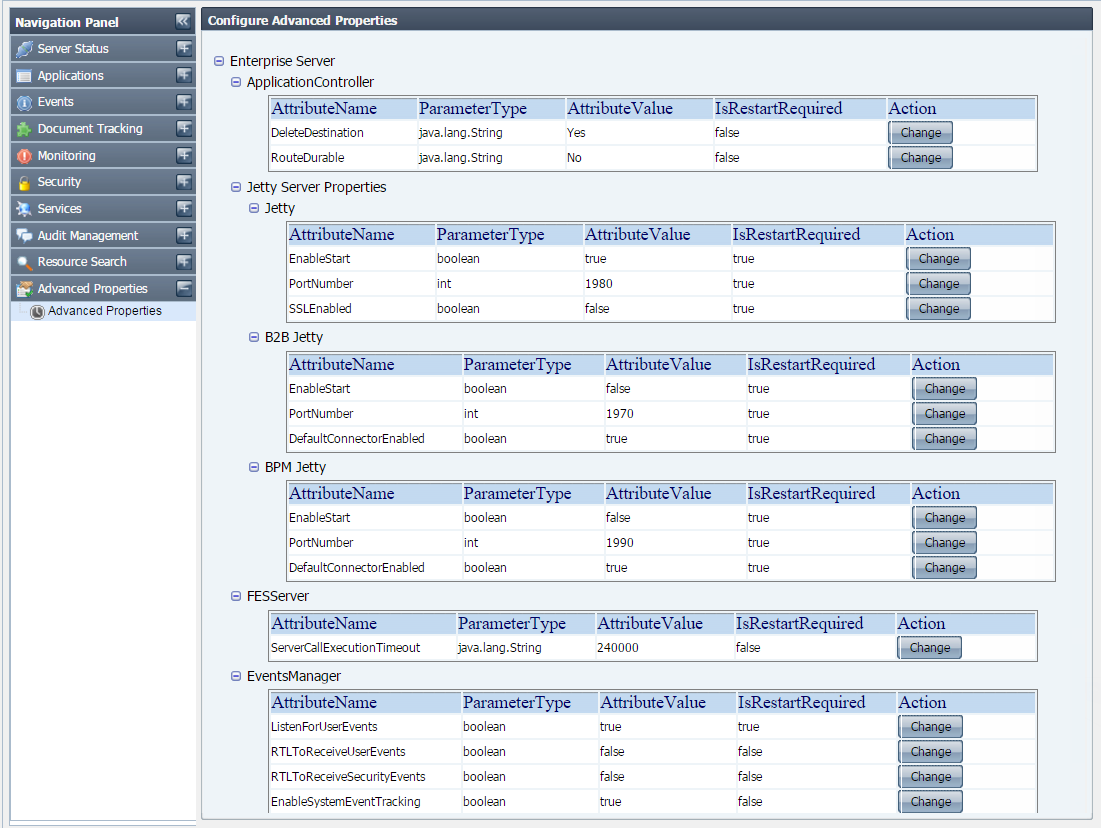
Figure 60: Advanced Properties
Click the Change button of the attribute whose value has to be changed; Change value dialog box appears. Click OK after changing the value.
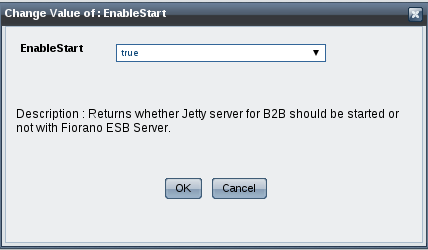
Figure 61: Change Attribute Value
Enabling Fiorano Web Console
The Fiorano Web Console can be enabled from Online as well as Offline mode.
Online mode
To enable Fiorano Web Console in online mode (server running):
- Login to Peer server via JMX(FPS-JMX)
- Navigate to Fiorano > etc > Jetty Server > JettyServer > config and set EnableStart property to 'yes'.
- Right-click on FPS-JMX and click Save Configurations option.
- Shut down both Peer and Enterprise servers.
Offline mode
To enable Fiorano Web Console in offline mode (server not running):
- Open profile in eStudio, browse to Fiorano > etc > Jetty Server > JettyServer > config and set EnableStart property to 'yes'.
- Save profile.
After editing profile (online or offline), perform the following actions:
Clear peer repository using the following command
- Restart the servers.