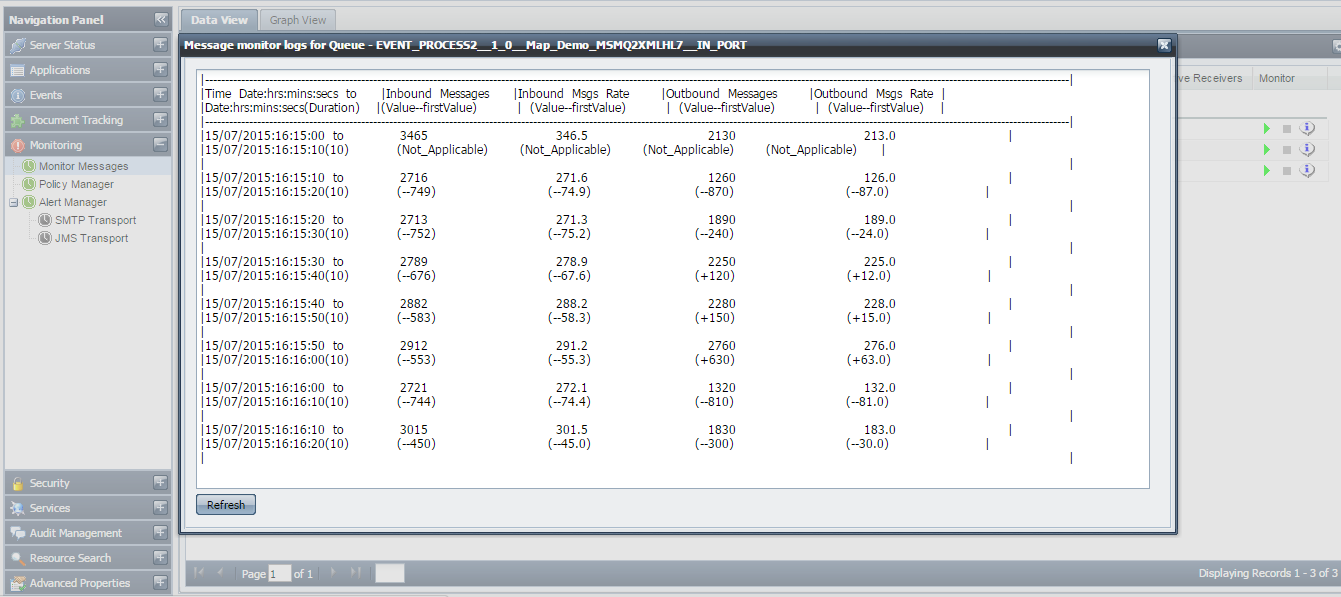
Message Monitoring logs help you to track the rate of message transfer occurring across queues on the setup.
Below sections explain how to enable the Message Monitoring feature on the Peer Server in order to generate message logs.
Enable Message Monitoring
To enable message monitoring, login to the Fiorano eStudio and then follow the sections below.
Enabling while Servers are not running
In case the server is not running, the property can be enabled on the peer to be monitored using the steps below:
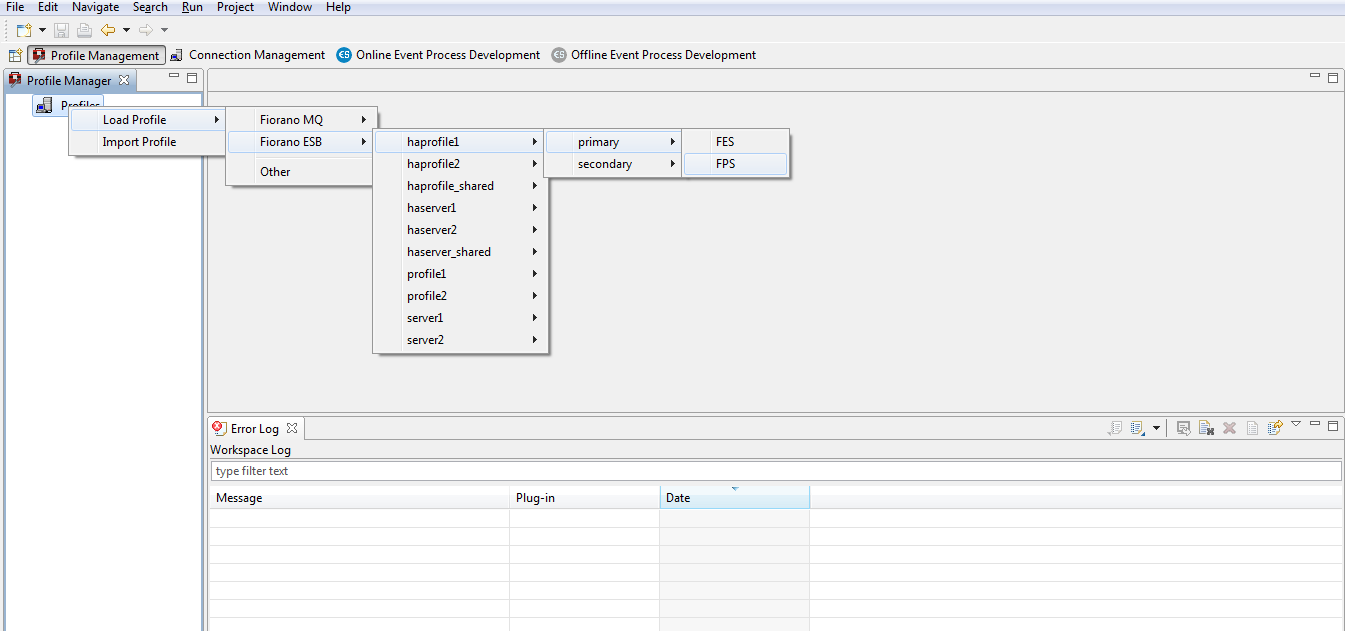
- Load the profile from the Profile Management perspective in eStudio.
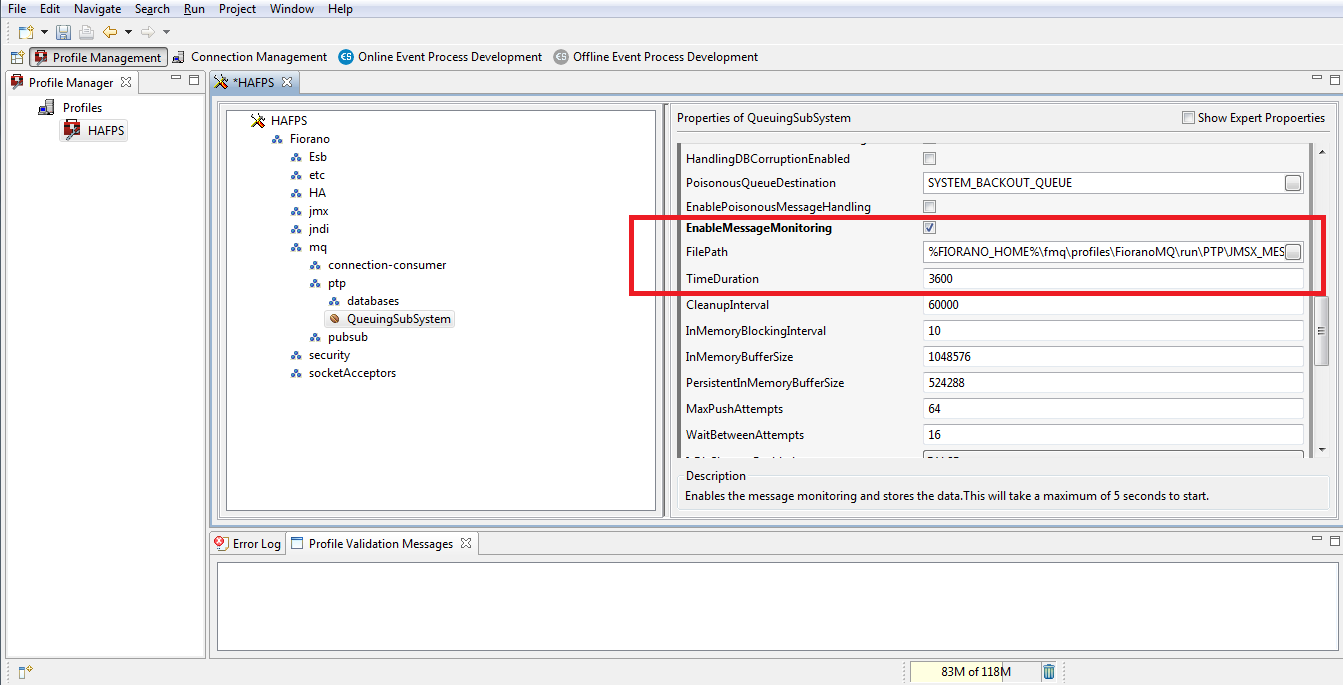
- Navigate to Firoano > mq > ptp > QueuingSubSytem and select the EnableMessageMonitoring property. Also, provide the following property values:
FilePath: Path where the monitoring logs has to be stored.
- TimeDuration: The interval between which the rate needs to be calculated.
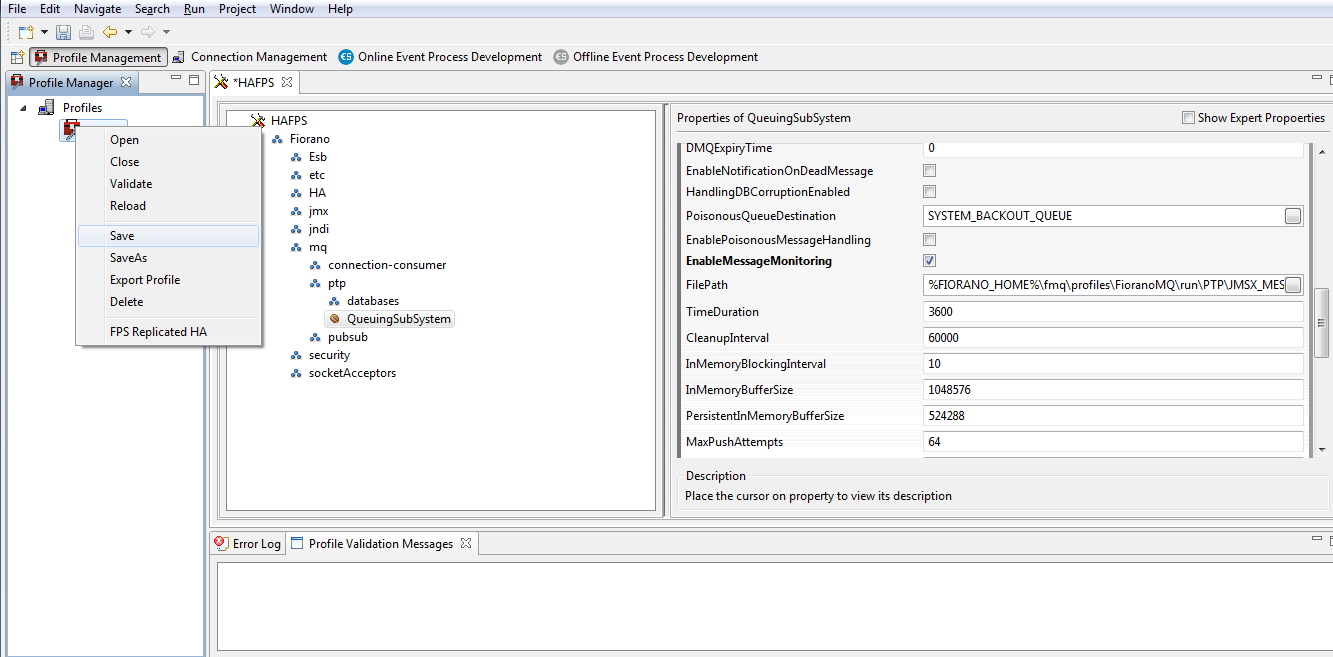
- Save the profile and start the servers.
Enabling while Servers are running
When servers are running, the message monitoring can be enabled through JMX. Perform the following actions from Connection Management perspective.
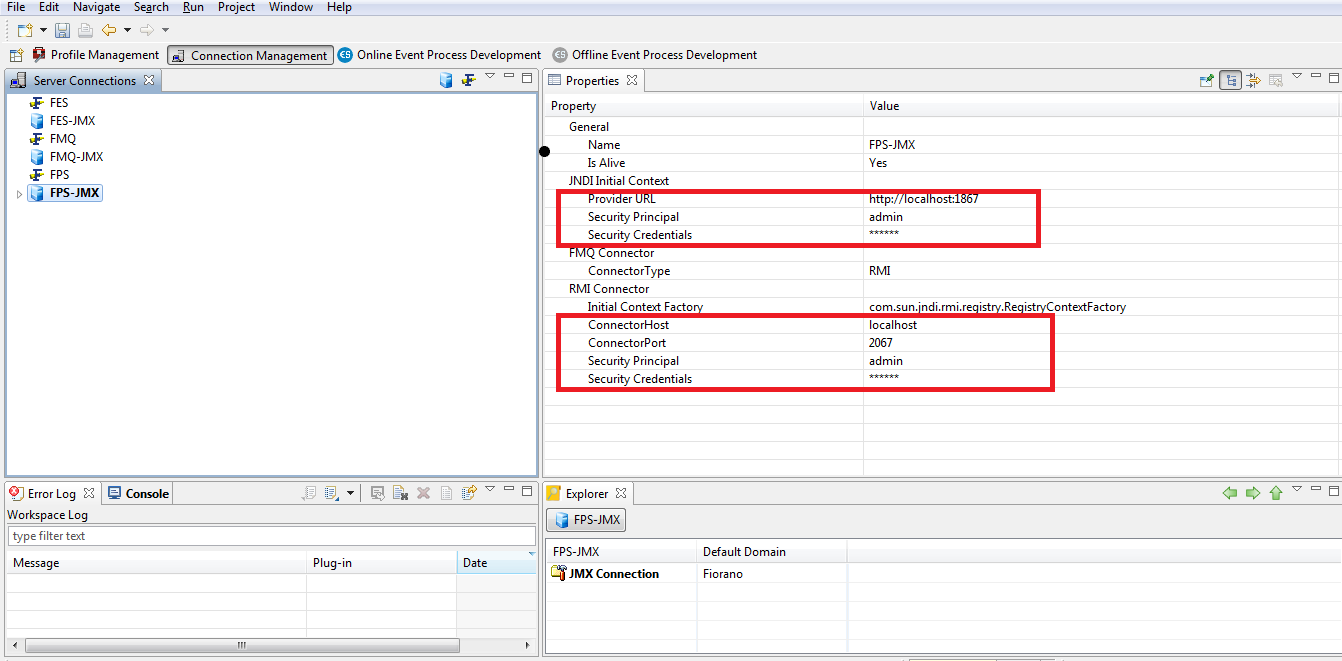
- Login to FPS-JMX of the peer server on which message monitoring is to be enabled.
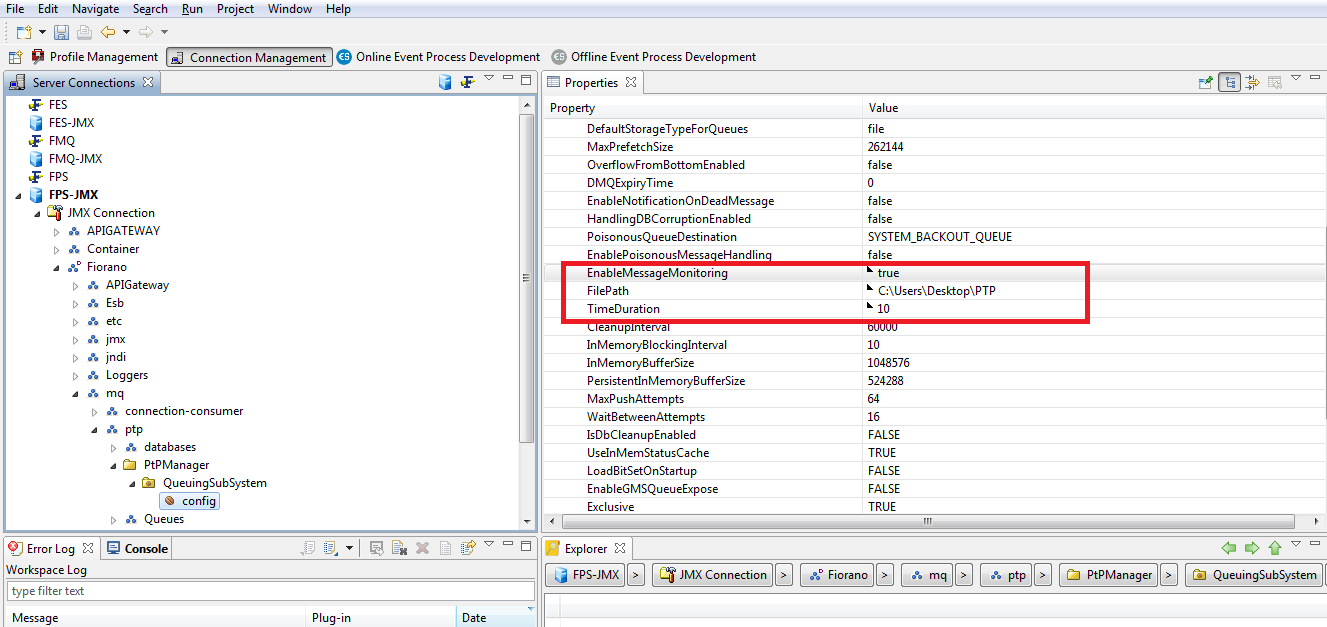
- Navigate to JMX Connection > Fiorano > mq > ptp > QueuingSubSystem > config, and set the EnableMessageMonitoring to true. Also provide the following property values:
FilePath: Path where the monitoring logs will be stored.
- TimeDuration: The interval between which the rate needs to be calculated.
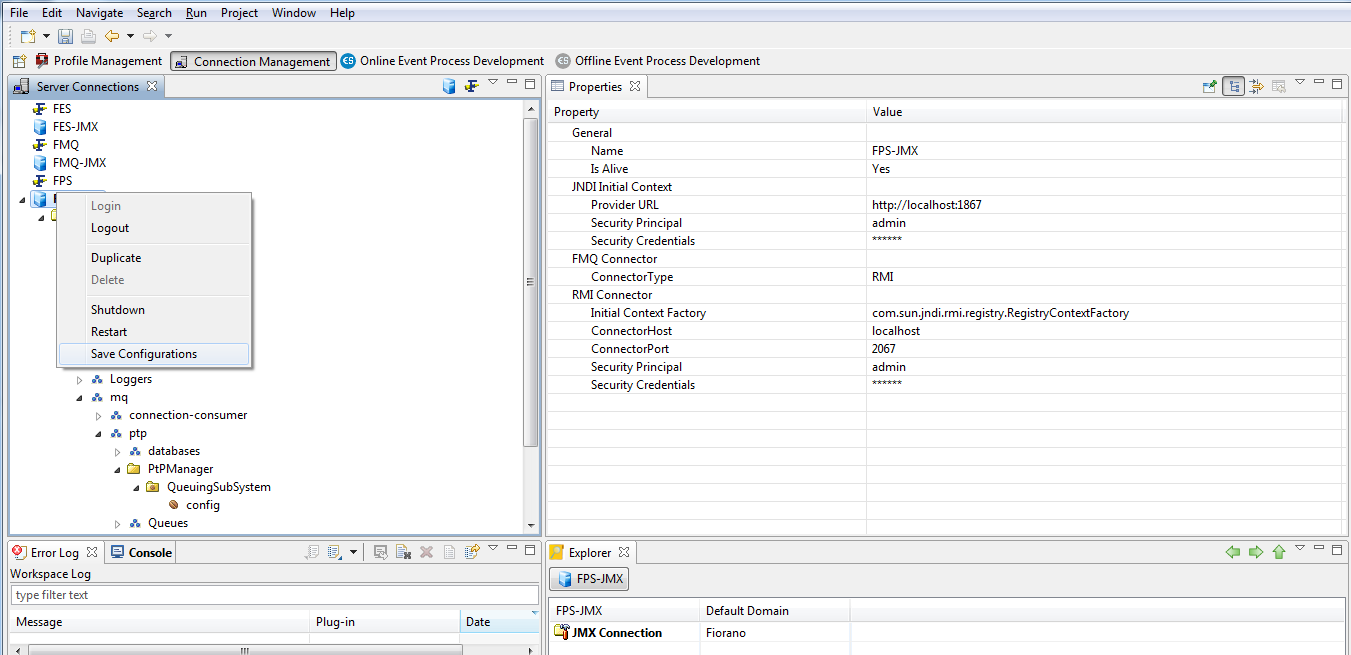
- Save the configurations and logout.
View Message Monitoring Logs
To view message monitoring logs, login to the Dasboard (Fiorano Console) and perform the following actions:
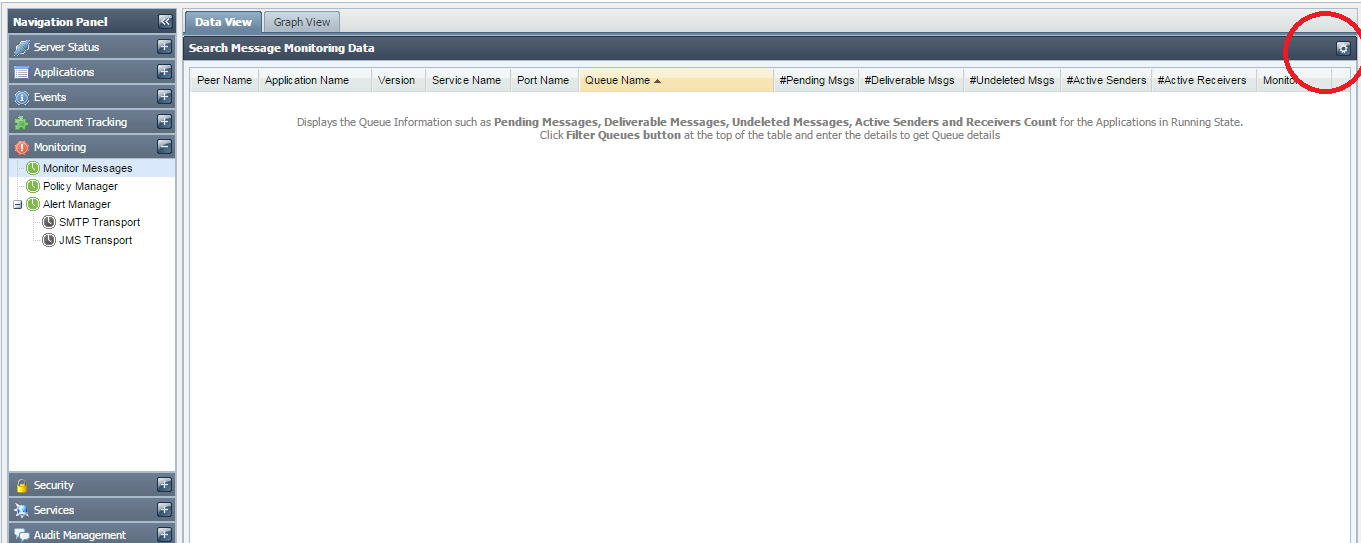
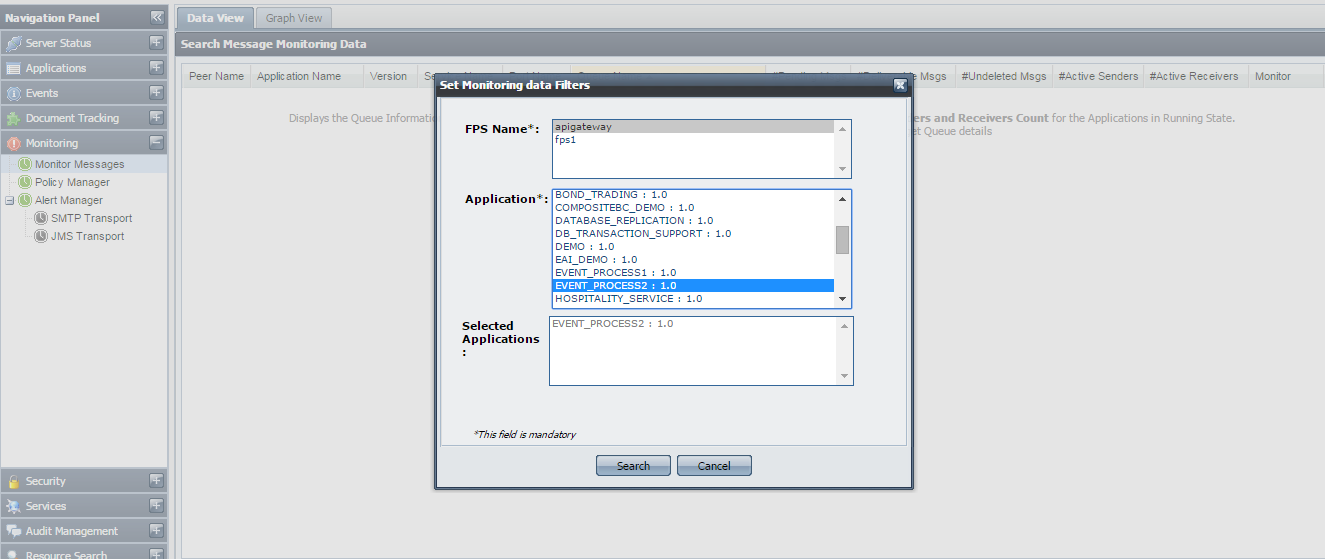
- In the left navigation panel, navigate to Monitoring > Monitor Messages and select the Monitoring Filter button present at the upper-right part of the screen.
- In the Set Monitoring data filters dialog box that pops up, select the peer and application(s) that needs to be monitored in the peers, and click the Search button to list all the queues for the selected application(s).
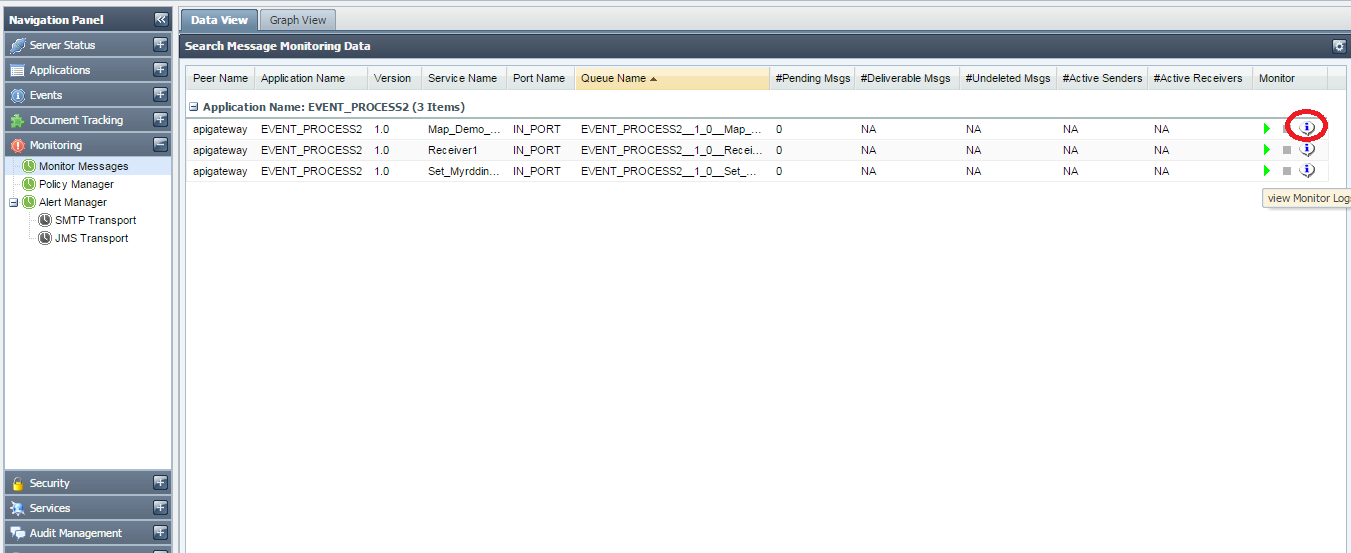
- Click the View Monitor Logs button present at the extreme right of each row that represents a queue in order to view logs for monitoring the respective queue.
- The log window pops up displaying the monitoring logs of the selected queue.
