In the Fiorano Environment, each component is launched (by default, unless specifically configured otherwise) in a separate JVM Process. It is very important to tune the heap memory allocated to each service component and the Fiorano servers to achieve stable, high throughput, and highly optimized memory usage of the Fiorano Environment.
Tuning Memory for Service Components
Each service component has to be tuned to achieve high performance and stability. There cannot be strict recommendations on the heap memory usage for components, as the memory usage of a component is highly dependent on the "context" in which it is used. The Context could be the physical hardware like the number of processors/physical memory size, the configuration with which the component is running, the size of the incoming message, the frequency of service invocation, JVM specific parameters like the version, type of JVM (32 bit/64 bit), the JVM garbage collection algorithm and other memory competing software(s) running on the system and, finally, in some cases the internal implementation of the component itself.
This document makes some recommendations for components running under preset contexts. These recommendations should be considered as guidelines and ideally, the tuning process has to be done based on the general guidelines outlined herein along with the specific instructions for each service component instance.
Know about Heap sizes
The heap is a section of memory used by the JVM to store the Java objects. You can set constraints on the size of the heap with two parameters passed to the JVM at startup: -Xms sets the initial size of the heap and -Xmx sets the maximum size of the heap. If you set those two parameters to different values, say 32 MB and 256 MB, then it is vital to instruct the JVM to start with a heap size of 32 MB and increase the size up to 256 MB "as necessary". In this case, the JVM has to balance two conflicting constraints: not request too much memory from the operating system (getting to 256 MB too quickly), and not request too little memory as that increases the amount of time the JVM spends on garbage collection which reduces the performance of the application.
Asking the JVM to balance memory usage and performance by setting different values for -Xms and -Xmx is critical in a situation where multiple components are being run on the same hardware system and the components are actively competing for resources - in particular, memory resources.
Default Heap size
By default, all components are launched without any JVM Memory settings. The following rules govern the size of the heap allocated by default by JVM if no memory settings were specified explicitly.
From J2SE 5.0, a machine is classified as a server-class machine if it has:
- 2 or more physical processors
- 2 or more GB of physical memory
Java version | Default Garbage Collection Algorithm | Machine class | Initial Heap Size | Maximum Heap Size |
|---|---|---|---|---|
1.4 and before | Serial Garbage Collector | Client/Server | 4 MB | 64 MB |
J2SE 5.0 and above | Throughput garbage Collector | Client | 4 MB | 64 MB |
J2SE 5.0 and above | Throughput garbage Collector | Server | 1/64 of physical memory up to 1 GB | ¼ of physical memory up to 1 GB |
The definition of a server-class machine applies to all platforms with the exception of 32-bit platforms running the Microsoft Windows operating system. On all other platforms, the default values are the same as the default values for JDK version 1.4. The following table illustrates the choice of the machine class for common platforms and Operating system combinations.
Platform | Operating System | Default | Default class |
|---|---|---|---|
Sparc (32-bit) | Solaris | Client | Server |
I586
| Solaris | Client | Server |
Linux | Client | Server | |
Windows | Client | Client | |
Sparc(64-bit) | Solaris | Server | Server |
AMD(64-bit)
| Linux | Server | Server |
Windows | Server | Server | |
IA-64
| Linux | Server | Server |
Windows | Server | Server |
Setting Heap sizes
The -Xmx and –Xms settings can be set for a particular Fiorano component as part of the JVM_PARAMS runtime parameters attributes as illustrated in Figure 1. Multiple JVM runtime parameters can be added and separated with space as the delimiter. The Heap Size setting should be set in the following format: –Xmx[value][[optional]mem_char]. By default, all specified values are measured in bytes. You can append the letter `k' or `K' to the value to indicate kilobytes, `m' or `M' to indicate megabytes, and `g' or `G' to indicate gigabytes. This attribute is a common attribute for all service components.
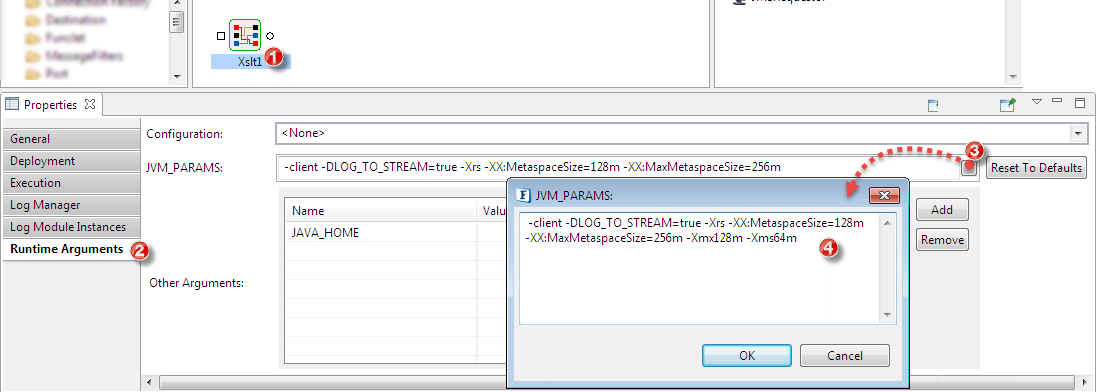
Figure 1: Setting the JVM _PARAMS attributes of a Component Instance
Garbage Collection
Garbage collection is a process of releasing the memory currently allocated by unused java objects in the Heap Space. The Heap Space contains all the objects created in the Java program. When an object is no longer used by any of the pointers, the object is garbage and it can be released. The recommended values for -Xmx and -Xms largely depend on the load/size of the messages processed by the component and other component implementation-specific parameters. The JVM heap size specified for the component determines how often the VM collects garbage and how much time it spends on each garbage collection sweep. An acceptable rate for garbage collection is application-specific. It is generally recommended that the JVM spends significantly less than 30% of its time on garbage collection; this time should be adjusted after analyzing the actual time and frequency of garbage collections. The goal of tuning the heap size is to minimize the time that it spends doing garbage collection while maximizing the number of messages that the component can handle at a given time. It is recommended that the following factors are analyzed for the optimum setting of the Xmx and Xms parameters:
- Frequency of garbage collection? If the garbage collection is occurring too frequently, then increasing the maximum heap setting is recommended.
- How long is garbage collection taking? As a recommendation, full garbage collection should take no longer than 3 to 5 seconds. If it takes more time, then reducing the maximum heap size is recommended.
- What is the average memory footprint? In other words, what does the heap settle back down to after each full garbage collection? If the heap always settles to 85% free, reducing the maximum heap size is recommended.
- Typically the -Xmx parameter settings for all the components and the Peer Server should account for 80% of the available physical memory.
- Typically the -Xms parameter settings for all the components should be much less than 50% of the available physical memory.
Monitoring Component JVM Statistics
There are several JVM profilers available for monitoring the heap size, the garbage collection statistics, the thread-count and the count of the number of classes loaded for the component JVM. Java has an inbuilt tool to profile the JVM using JConsole as part of the Java SDK distribution. Fiorano recommends the free Netbeans profiler for monitoring the component JVM statistics. The exact set of steps depending on the version of Netbeans used and can be found at www.Netbeans.org.
- Run the Netbeans Profiler Calibration
- Configure the Netbeans profiler
- The Profiler task should be analyzing memory usage
- It is recommended that the Profiler is setup on a different machine than the machine on which the Fiorano Peer Server is installed because profiling in itself is a CPU-intensive, memory consuming task.
- Netbeans provides the runtime arguments to be added to the external application on launch. Copy the parameters as specified and as required into a text editor.
- Configure the Fiorano component runtime parameters. Add the copied runtime arguments from step 2 (c) above to the service component JVM_PARAMS runtime argument as shown in figure 2
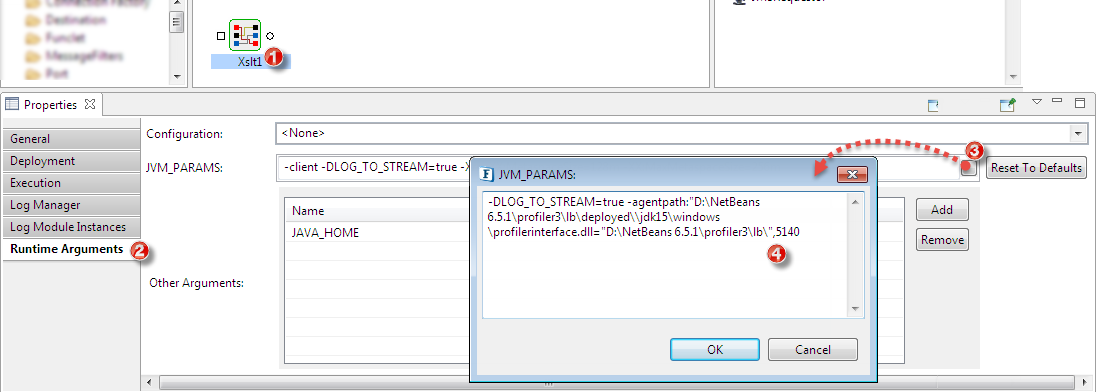
Figure 2: Adding the profiler settings to the JVM_PARAMS - Launch the component/application. Note: the component will not start until the Profiler is attached to the Java process.
- Attach the Netbeans Profiler. The profiler should start collecting the statistics on heap memory usage together with the garbage collection statistics. Switching to VM telemetry view is needed.
Tuning the memory settings
It is recommended that the production environment is simulated to determine how the component/application is typically used before one starts tuning memory settings. Once the component is running and the profiler is attached an analysis can be performed to determine whether a component is stable, suffocated, dangerous or well tuned, as described in the sections that follow.
Stable Component
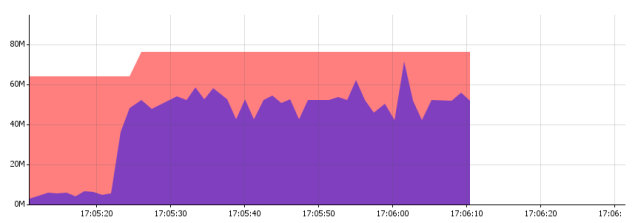
The graph of figure 3 below suggests that the memory utilization of a component after the initialization of a very minimum heap size shoots up to a specified level and remains at that level even after you have requested a Full System Garbage Collection (Using Netbeans). (Note: Java does not guarantee that Garbage collection will happen if the command is executed, but there is a good chance it does for the most part). Such a level is a good recommendation for the Xms setting of the service component. The service component memory usage is stable under the tested scenario and it is recommended that the Xmx and Xms settings be set to values on the upper bound and lower bound of the graph respectively.
![]()
Figure 3: Stable component memory utilization
Suffocated Component
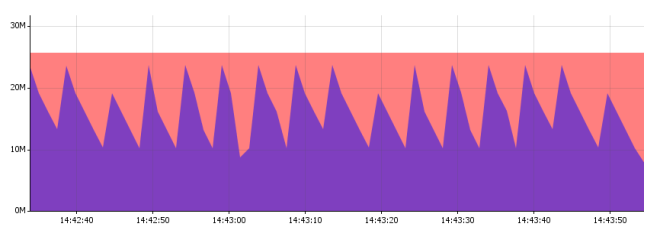
Figure 4 graph suggests that the actually used heap memory reaches the allocated heap memory too often and when the allocated heap memory is below the Maximum memory setting, a partial garbage collection is done on the Eden space (younger generation) of the heap space; this is fine as long as the Eden space is kept at low number (default not modified), but if the allocated heap memory in the above case is set to the Maximum memory, a full System garbage collection is issued, which ideally should not occur too often. When the graph shows steep peaks too often as illustrated in figure 4 and if the allocated heap size is close to the maximum memory utilization of the component JVM, then it is recommended that the allocated heap space should be increased.
![]()
Figure 4: Suffocated component memory utilization
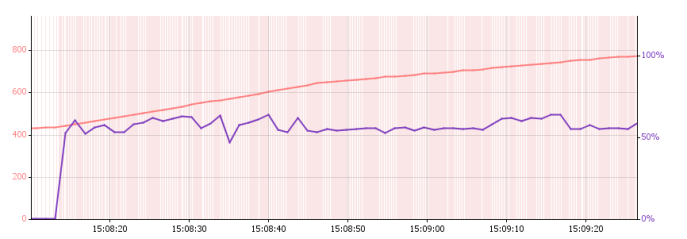
Typically for "suffocated" components, the garbage collection statistics are also very important to observe. If the component is spending more than 30% of the time on Garbage collection, then there is a good chance that the component is underperforming significantly. It is therefore recommended that the maximum memory heap space should be increased in such cases. The GC static graph in figure 5 below definitely suggests that the component needs more heap space.
![]()
Figure 5: Memory utilization of a Component instance that needs more heap space
Dangerous Component
It is typically the case that most users tune a component with a very high heap Memory setting for the best performance since the frequency with which garbage collection happens will then be very low and most processor time for the JVM is dedicated to the component. This is a good option when it is possible to calculate or know for certain the component does not reach the maximum memory limit or, if it does reach the maximum memory limit, that the time then taken for garbage collection is acceptable. Because the heap memory limit is very high, the Garbage Collection process takes proportionately longer. So a downside of setting a high upper limit on the heap space for a component instance is that the Garbage Collection Process can sometimes take an inordinate amount of time. This can have some repercussions as discussed below:
The distinct plateaus in the garbage collection statistics of figure 5 above suggest that for the length of each plateau a full GC has been running which is generally a "Stop the World" process, making the component unresponsive for that length of time. A lengthy garbage collection process can lead to several complications as there can be a random/ considerable amount of delay in the processing time of the component. More importantly, the JMS connection made by the component to the Fiorano Peer Server to which it is connected could be invalidated depending on the ping timeout set on the connection parameter which might cause the component to stop execution or kill itself.
In such cases, it is recommended that the Minimum memory or the maximum memory settings are reduced as appropriate:
- If the time taken on the GC done over the Eden space of the component JVM Heap when the used heap space reaches the minimum memory setting is unacceptable (which is less likely), then it is recommended to reduce the minimum heap setting.
- If the time taken on the Full System GC over the entire Heap space including perm gen of the component JVM Heap when the used heap space reaches the maximum memory setting is unacceptable (which is more likely), then it is recommended to reduce the maximum heap setting and perform the tuning again.
Well-tuned component
A well-tuned component, as illustrated in figure 6, neither performs garbage collection very frequently nor does it take an unacceptable amount of time performing garbage collection. The heap memory size does not shoot up or come down drastically at any point. It is generally quite stable increasing from the minimum heap size to the maximum heap size and then back to the minimum heap size, which should be the amount of memory needed by the component.
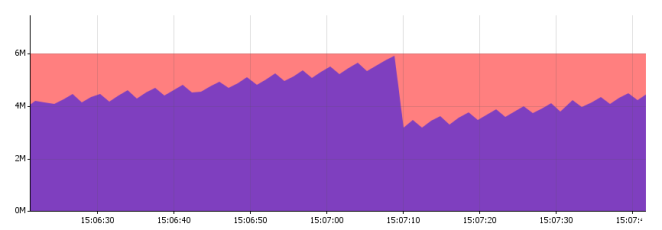
Figure 6: A well-tuned component
As shown in figure 7, the garbage collection graph displays uniform behavior below the 30 % mark and there are no high peaks for an extended period of time. This balance is very important to strike for every Fiorano service component instance.
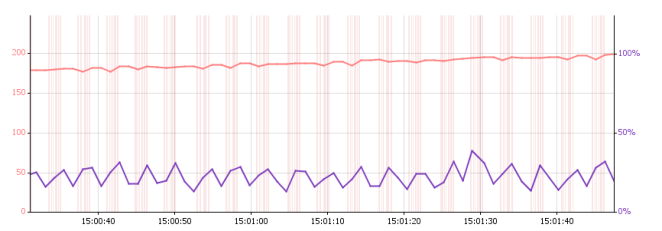
Figure 7: Garbage collection graph for a well-tuned component
Recommendations
Component Overloading
During the application design/architecture phase, the following factors are to be considered regarding the number of components to be launched on a Fiorano Peer Server.
- Component Maximum Heap Size and the Minimum Heap sizes after performing the tuning for heap size memory as discussed in the previous sections.
- List of memory and CPU intensive programs running on the same system and the Maximum memory required for these programs.
- Fiorano Peer Server Heap setting after it is tuned with all the in-memory components in a simulated production scenario.
Fiorano recommends the following:
- The Fiorano Peer Server and Fiorano components should be the only memory and CPU intensive applications running on the production system.
- Fiorano Peer Server Xms and Xmx parameters are set to the same value or to values that are close to each other. This sort of setting is generally recommended for servers to achieve optimal performance. The value which needs to be set for the Xmx and Xms parameters should be deduced by performing the tuning operations with simulated production runs.
- For maximum performance, Fiorano recommends that the server system should have "enough" RAM so that there is never a shortage and that page faults essentially never happen.
- The Maximum heap size for the Fiorano Peer Server and all the components should not exceed 75% of the virtual memory space. It is recommended to have the total of the maximum heap sizes equal to 85% of the available physical memory. Virtual memory is the sum of the Physical Memory and the Page File Memory.
So if your computer has 4 GB RAM, and 2 GB RAM is being set as the page file size, then available Virtual memory is 6 GB RAM and 75% of this value is 4.5 GB. If the Fiorano Peer Server and Fiorano components total of the maximum heap sizes are close to 4.5 GB, then this indicates that the "Architectural Limit" has been reached. Loading memory over this limit does not guarantee a stable Fiorano environment.
Components
The following sections provide some guidelines on how different contextual parameters affect the heap memory utilized by some of the most commonly used Fiorano components. These parameters can sometimes be categorized into buckets of common usage; some parameters cannot be categorized as each distinct value leads to a non-extrapolative distinct behavior. For such parameters, the values are fixed based on the most common usage and these values are specified in the recommendations. For all other parameters, based on different categorizations, some memory setting recommendations are made. These numbers are only indicative and should not be used as a very strict guideline; they only indicate a rough estimate of the memory settings under the specified mode of usage and can be considered a good starting point for specific tuning based on your own environment and parameter settings.
If the component is launched within the same JVM as the Fiorano Peer Server, the libraries and classes loaded by the peer servers and other components launched in-memory are shared. Since there is no separate process, the JVM does not need to create a separate stack space as the memory spaces are shared between the component and the Fiorano Peer Server. In this case, there will only be an increase in the heap space of the Fiorano peer server. The Peer Server JVM has to be re-tuned each time a new component is launched in-memory. For Fiorano Peer Server, use the same procedure to tune the memory settings as discussed in the previous sections for components.
File Reader
The File Reader component reads files from the file system and sends their contents to the output port, typically as XML documents. The source file can either be text or binary depending on the value of the "Is File binary" attribute. The following factors determine the setting of an optimum Heap Space for the component.
- If the file reader is configured to read text files, the Size of the text file, as one single FioranoTextMessage is constructed from the contents of the entire text file.The entire size of the file characters is allocated at the same time.
- The frequency of reading the files and publishing the message. If Scheduling is enabled, the interval at which the files are being read or the number of files in the working directory (depending on POST_PROCESS_ACTION) or the frequency of messages in the input port of the File reader.
Recommendation 1
Initialization Context:
- Is Input File Binary – no
- Frequency of operation – > 1 sec
- In-memory – no
- Hardware - Dual core 2.1 GHz, 4 GB Ram
- OS - Windows XP Professional 32 Bit
- JVM - version 1.5.0_18, 32 bit
Message Size
| Operating Range
| Recommended Memory Setting
| Time spent in GC
| ||||
|---|---|---|---|---|---|---|---|
Minimum | Maximum | Maximum (MB) | Minimum (MB) | Maximum (MB) | Minimum (MB) | Maximum (%) | Minimum (%) |
0 | 5KB | 5 | 4 | 32 | 4 | 5 | 0 |
5KB | 500KB | 15 | 10 | 32 | 4 | 15 | 10 |
500KB | 1MB | 20 | 10 | 64 | 4 | 20 | 15 |
1MB | 5MB | 45 | 28 | 128 | 32 | 15 | 5 |
5MB | 10 MB | 75 | 50 | 128 | 64 | 20 | 10 |
10 MB | - | - | - | 256 | 128 | - | - |
Recommendation 2
Initialization Context:
- Is Input File Binary – no
- Frequency of operation – ~ 100 milliseconds
- In-memory – no
- Hardware – Dual core 2.1 GHz, 4 GB Ram
- OS – Windows XP Professional 32 Bit
- JVM – version 1.5.0_18, 32 bit
Message Size
| Operating Range
| Recommended Memory Setting
| Time spent in GC
| ||||
|---|---|---|---|---|---|---|---|
Minimum | Maximum | Maximum (MB) | Minimum (MB) | Maximum (MB) | Minimum (MB) | Maximum (%) | Minimum (%) |
0 | 5KB | 6 | 4 | 32 | 4 | 5 | 0 |
5KB | 500KB | 25 | 10 | 32 | 16 | 15 | 10 |
500KB | 1MB | 30 | 15 | 64 | 32 | 20 | 15 |
1MB | 5MB | 45 | 30 | 128 | 64 | 15 | 5 |
5MB | 10 MB | 75 | 50 | 128 | 64 | 20 | 10 |
10 MB | - | - | - | 256 | 128 | - | - |
Recommendation 3
Initialization Context:
- Is Input File Binary – yes
- Chunk size – 1024 KB
- Frequency of operation – ~ 100 milliseconds
- Hardware – Dual core 2.1 GHz, 4 GB Ram
- OS – Windows XP Professional 32 Bit
- JVM – version 1.5.0_18, 32 bit
Message Size
| Operating Range
| Recommended Memory Setting
| Time spent in GC
| ||||
|---|---|---|---|---|---|---|---|
Minimum | Maximum | Maximum (MB) | Minimum (MB) | Maximum (MB) | Minimum (MB) | Maximum (%) | Minimum (%) |
0 | - | 30 | 15 | 64 | 16 | 20 | 15 |
File Writer
The File Writer component writes the received data from its input port to the specified output File. The received data can either be plain text or binary data. The following factors determine the setting of an optimum Heap Space for the component:
- The Size of the input message.
- The frequency of the requested operation. If Scheduling is enabled, then the interval at which the files are being read or the number of files in the working directory (depending on POST_PROCESS_ACTION) or the frequency of messages arriving at the input port and written to the output port of the File reader.
Recommendation 1
Initialization Context:
- Frequency of operation – > 1 second
- Hardware – Dual core 2.1 GHz, 4 GB Ram
- OS – Windows XP Professional 32 Bit
- JVM – version 1.5.0_18, 32 bit
Message Size
| Operating Range
| Recommended Memory Setting
| Time spent in GC
| ||||
|---|---|---|---|---|---|---|---|
Maximum | Minimum | Maximum (MB) | Minimum (MB) | Maximum (MB) | Minimum (MB) | Maximum (%) | Minimum (%) |
0 | 5KB | 4 | 3 | 32 | 4 | 5 | 0 |
5KB | 500KB | 14 | 10 | 32 | 4 | 20 | 10 |
500KB | 1MB | 20 | 15 | 64 | 4 | 20 | 15 |
1MB | 5MB | 60 | 40 | 128 | 64 | 25 | 20 |
5MB | 10 MB | 110 | 65 | 128 | 64 | 15 | 10 |
10 MB | - | - | - | 256 | 128 | - | - |
Recommendation 2
Initialization Context:
- Frequency of operation – ~ 100 milliseconds
- Hardware – Dual core 2.1 GHz, 4 GB Ram
- OS – Windows XP Professional 32 Bit
- JVM – version 1.5.0_18, 32 bit
Message Size
| Operating Range
| Recommended Memory Setting
| Time spent in GC
| ||||
|---|---|---|---|---|---|---|---|
Maximum | Minimum | Maximum (MB) | Minimum (MB) | Maximum (MB) | Minimum (MB) | Maximum (%) | Minimum (%) |
0 | 5KB | 10 | 8 | 32 | 4 | 5 | 0 |
5KB | 500KB | 35 | 25 | 64 | 32 | 10 | 10 |
500KB | 1MB | 40 | 30 | 64 | 32 | 20 | 15 |
1MB | 5MB | 65 | 55 | 128 | 64 | 15 | 5 |
5MB | 10 MB | 130 | 95 | 256 | 64 | 20 | 10 |
10 MB | - | - | - | 256 | 128 | - | - |
XSLT
XSLT is a component that executes an XSL and converts XML from one format to another. The memory utilization of this component depends on:
- Transformation Complexity
- Message Size
CBR
The Content based router (CBR) is used to route messages to different routes based on the XML content of the message. The routing logic is based on applying an XPath selector over the incoming message. The following factors determine the setting of an optimum Heap space for the CBR component:
- Complexity of the XPath evaluations
- Number of XPath evaluations and the number of output ports configured
- Size of the input message on which the XPaths are evaluated
- Frequency of input messages
Recommendation 1
Initialization Context:
- Frequency of operation – > 1 Second
- No of Output Ports – ~ 3
- Complexity level of XPaths – Simple ( Simple function and operator)
- Hardware – Dual core 2.1 GHz, 4 GB Ram
- OS – Windows XP Professional 32 Bit
- JVM – version 1.5.0_18, 32 bit
Initial component size: 3 MB
Threads loaded: 8 and are constant throughout the execution
Approximate number of classes loaded: 2500
Message Size
| Operating Range
| Recommended Memory Setting
| Time spent in GC
| ||||
|---|---|---|---|---|---|---|---|
Maximum | Minimum | Maximum (MB) | Minimum (MB) | Maximum (MB) | Minimum (MB) | Maximum (%) | Minimum (%) |
0 | 5KB | 7 | 4 | 32 | 4 | 0 | 0 |
5KB | 500KB | 12 | 8 | 32 | 4 | 20 | 15 |
500KB | 1MB | 30 | 15 | 64 | 32 | 15 | 10 |
1MB | 5MB | 90 | 55 | 128 | 64 | 10 | 5 |
5MB | 10 MB | 120 | 100 | 128 | 64 | 10 | 5 |
10 MB | - | - | - | 256 | 128 | - | - |
Recommendation 2
Initialization Context:
- Frequency of operation – ~ 100 Milliseconds
- No of Output Ports – ~ 3
- Complexity level of XPaths – Simple ( Simple function and operator)
- Hardware – Dual core 2.1 GHz, 4 GB Ram
- OS – Windows XP Professional 32 Bit
- JVM – version 1.5.0_18, 32 bit
Initial component size: 3 MB
Threads loaded: 8 and are constant throughout the execution
Approximate number of classes loaded: 2500
Message Size
| Operating Range
| Recommended Memory Setting
| Time spent in GC
| ||||
|---|---|---|---|---|---|---|---|
Maximum | Minimum | Maximum (MB) | Minimum (MB) | Maximum (MB) | Minimum (MB) | Maximum (%) | Minimum (%) |
0 | 5KB | 6 | 4 | 32 | 4 | 10 | 0 |
5KB | 500KB | 30 | 10 | 64 | 32 | 20 | 15 |
500KB | 1MB | 40 | 20 | 64 | 48 | 10 | 5 |
1MB | 5MB | 100 | 60 | 128 | 64 | 10 | 5 |
5MB | 10 MB | 120 | 70 | 128 | 64 | 10 | 5 |
10 MB | - | - | - | 256 | 128 | - | - |
Recommendation 3
Initialization Context:
- Frequency of operation – > 1 Second
- No of Output Ports – ~ 8
- Complexity level of XPaths – Simple ( Simple function and operator)
- Hardware – Dual core 2.1 GHz, 4 GB Ram
- OS – Windows XP Professional 32 Bit
- JVM – version 1.5.0_18, 32 bit
Initial component size: 3 MB
Threads loaded: 8 and are constant throughout the execution
Approximate number of classes loaded: 2500
Message Size
| Operating Range
| Recommended Memory Setting
| Time spent in GC
| ||||
|---|---|---|---|---|---|---|---|
Maximum | Minimum | Maximum (MB) | Minimum (MB) | Maximum (MB) | Minimum (MB) | Maximum (%) | Minimum (%) |
0 | 5KB | 8 | 6 | 32 | 4 | 0 | 0 |
5KB | 500KB | 12 | 8 | 32 | 4 | 15 | 10 |
500KB | 1MB | 45 | 30 | 64 | 32 | 25 | 10 |
1MB | 5MB | 120 | 80 | 128 | 64 | 15 | 10 |
5MB | 10 MB | 120 | 100 | 256 | 128 | 10 | 5 |
10 MB | - | - | - | 256 | 128 | - | - |
Recommendation 4
Initialization Context:
- Frequency of operation – ~ 100 Milliseconds
- No of Output Ports – ~ 8
- Complexity level of XPaths – Simple ( Simple function and operator)
- Hardware – Dual core 2.1 GHz, 4 GB Ram
- OS – Windows XP Professional 32 Bit
- JVM – version 1.5.0_18, 32 bit
Initial component size: 3 MB
Threads loaded: 8 and are constant throughout the execution
Approximate number of classes loaded: 2500
Message Size
| Operating Range
| Recommended Memory Setting
| Time spent in GC
| ||||
|---|---|---|---|---|---|---|---|
Maximum | Minimum | Maximum (MB) | Minimum (MB) | Maximum (MB) | Minimum (MB) | Maximum (%) | Minimum (%) |
0 | 5KB | 6 | 4 | 32 | 4 | 10 | 0 |
5KB | 500KB | 35 | 20 | 64 | 32 | 20 | 15 |
500KB | 1MB | 50 | 30 | 64 | 48 | 25 | 5 |
1MB | 5MB | 100 | 80 | 128 | 64 | 15 | 10 |
5MB | 10 MB | 125 | 100 | 256 | 64 | 10 | 10 |
10 MB | - | - | - | 256 | 128 | - | - |
Aggregator
This component collects and aggregates messages received on its IN_PORT based on a specified Completeness Condition. The collected messages are then forwarded as an aggregated bundle of messages to a component connected to its OUT_PORT. The Aggregator is a special message filter that receives a stream of messages and identifies messages that are correlated. When a complete set of messages has been received, the Aggregator collects information from each of these messages and publishes a single, aggregated message to the output port for further processing.
The Aggregator is not a stateless component unlike other simple routing components (like Content Based Router (CBR)) that are generally stateless. Stateless components process incoming messages one by one and are not required to maintain any information between messages. The Aggregator component also has an option to persist the aggregated message into an RDBMS.
The memory usage of the Aggregator component is heavily dependent on the Aggregation size. The Aggregation size is defined as the total size of all messages to be aggregated. This depends on the completeness condition.
Fiorano does not recommend turning the persistence off if the aggregation size is going to be more than 5 MB. The Aggregator uses DOM-based data structures for internal processing of XML files, and these structures typically utilize memory approximately 3-10 times the size of the input file. The memory required by the component in case of message persistence is set to no, thus directly proportional to the Aggregation size. The following factors determine the amount of heap memory taken up by an Aggregator Component:
- Aggregation Size
- Frequency of Aggregation happening
- Number of messages in the aggregation.
Recommendation 1
Initialization Context:
- Frequency of aggregation – ~ 5 Seconds
- Number of messages aggregated – 5 Messages
- Message Persistence – off
- Hardware – Dual core 2.1 GHz, 4 GB Ram
- OS – Windows XP Professional 32 Bit
- JVM – version 1.5.0_18, 32 bit
Initial component size: 5 MB
Threads loaded: 9 and are constant throughout the execution
Approximate number of classes loaded: ~ 2750
Aggregation Size
| Operating Range
| Recommended Memory Setting
| Time spent in GC
| ||||
|---|---|---|---|---|---|---|---|
Maximum | Minimum | Maximum (MB) | Minimum (MB) | Maximum (MB) | Minimum (MB) | Maximum (%) | Minimum (%) |
0 | 10KB | 7 | 3 | 32 | 4 | 0 | 0 |
10KB | 1MB | 25 | 20 | 64 | 16 | 15 | 10 |
1 MB | 3MB | 45 | 35 | 64 | 32 | 20 | 15 |
3MB | 5MB | 120 | 60 | 128 | 64 | 25 | 20 |
5MB | - | - | - | - | - | - | - |
Recommendation 2
Initialization Context:
- Frequency of aggregation – ~ 500 Milliseconds
- Number of messages aggregated – 5 Messages
- Message Persistence – off
- Hardware – Dual core 2.1 GHz, 4 GB Ram
- OS – Windows XP Professional 32 Bit
- JVM – version 1.5.0_18, 32 bit
Initial component size: 5 MB
Threads loaded: 9 and are constant throughout the execution
Approximate number of classes loaded: ~ 2750
Aggregation Size
| Operating Range
| Recommended Memory Setting
| Time spent in GC
| ||||
|---|---|---|---|---|---|---|---|
Maximum | Minimum | Maximum (MB) | Minimum (MB) | Maximum (MB) | Minimum (MB) | Maximum (%) | Minimum (%) |
0 | 10KB | 7 | 3 | 32 | 4 | 0 | 0 |
10KB | 1MB | 25 | 20 | 64 | 16 | 15 | 10 |
1 MB | 3MB | 60 | 35 | 128 | 32 | 15 | 10 |
3MB | 5MB | 180 | 130 | 256 | 128 | 15 | 10 |
5MB | - | - | - | - | - | - | - |
Recommendation 3
Initialization Context:
- Frequency of aggregation – ~ 5 Seconds
- Number of messages aggregated – 5 Messages
- Message Persistence – on
- Hardware – Dual core 2.1 GHz, 4 GB Ram
- OS – Windows XP Professional 32 Bit
- JVM – version 1.5.0_18, 32 bit
Initial component size: 5 MB
Threads loaded: 10 and are constant throughout the execution
Approximate number of classes loaded: ~ 3300
Aggregation Size
| Operating Range
| Recommended Memory Setting
| Time spent in GC
| ||||
|---|---|---|---|---|---|---|---|
Maximum | Minimum | Maximum (MB) | Minimum (MB) | Maximum (MB) | Minimum (MB) | Maximum (%) | Minimum (%) |
0 | 10KB | 8 | 6 | 32 | 4 | 0 | 0 |
10KB | 1MB | 30 | 20 | 64 | 16 | 15 | 10 |
1 MB | 3MB | 45 | 35 | 64 | 32 | 25 | 20 |
3MB | 5MB | - | - | - | - | - | - |
5MB | - | - | - | - | - | - | - |
Distribution
This component is used for distributing a workload of N Jobs amongst M flow processors. Typically this component is used before multiple instances of the same component and the load balancing mechanism in the component is used to distribute the messages received by this component. The component uses a weighted round robin mechanism. The following factors determine the heap memory used up by the Distribution component:
- Incoming message size
- Message Frequency
Recommendation 1
Initialization Context:
- Frequency of operation – > 1 seconds
- Hardware – Dual core 2.1 GHz, 4 GB Ram
- OS – Windows XP Professional 32 Bit
- JVM – version 1.5.0_18, 32 bit
Initial component size: 3 MB
Threads loaded: 8 and are constant throughout the execution
Approximate number of classes loaded: 2400
Message Size
| Operating Range
| Recommended Memory Setting
| Time spent in GC
| ||||
|---|---|---|---|---|---|---|---|
Maximum | Minimum | Maximum (MB) | Minimum (MB) | Maximum (MB) | Minimum (MB) | Maximum (%) | Minimum (%) |
0 | 5KB | 3 | 3 | 16 | 4 | 10 | 0 |
5KB | 500KB | 10 | 9 | 32 | 4 | 20 | 15 |
500KB | 1MB | 20 | 10 | 32 | 4 | 20 | 15 |
1MB | 5MB | 80 | 60 | 128 | 32 | 15 | 10 |
5MB | 10 MB | 90 | 70 | 128 | 64 | 15 | 10 |
10 MB | - | - | - | 256 | 128 | - | - |
Recommendation 2
Initialization Context:
- Frequency of operation – ~ 100 Milliseconds
- Hardware – Dual core 2.1 GHz, 4 GB Ram
- OS – Windows XP Professional 32 Bit
- JVM – version 1.5.0_18, 32 bit
Initial component size: 4 MB
Threads loaded: 8 and are constant throughout the execution
Approximate number of classes loaded: 2400
Message Size
| Operating Range
| Recommended Memory Setting
| Time spent in GC
| ||||
|---|---|---|---|---|---|---|---|
Maximum | Minimum | Maximum (MB) | Minimum (MB) | Maximum (MB) | Minimum (MB) | Maximum (%) | Minimum (%) |
0 | 5KB | 6 | 4 | 16 | 4 | 5 | 0 |
5KB | 500KB | 15 | 10 | 32 | 4 | 15 | 10 |
500KB | 1MB | 35 | 25 | 64 | 16 | 10 | 5 |
1MB | 5MB | 80 | 60 | 128 | 32 | 25 | 15 |
5MB | 10 MB | 100 | 70 | 128 | 64 | 25 | 20 |
10 MB | - | - | - | 256 | 128 | - | - |
Walkthrough
In this section, we consider a sample application walk-through the process for tuning the memory that is allocated to all the component instances.
Application
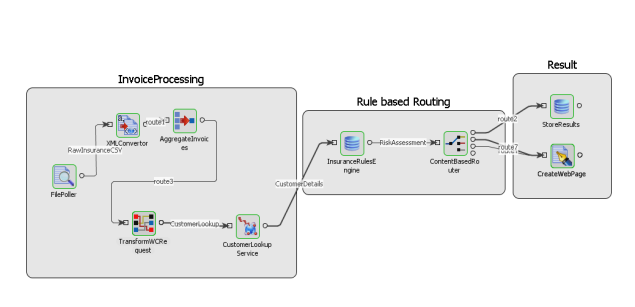
The above application performs the following actions:
- Pick up a CSV (Comma Separate Variable, text file) Insurance Request file from a Directory location and send the file contents to a Text2XML Converter.
- The Text2XML Converter converts the incoming file into XML and then sends the XML packet to an aggregator component.
- The aggregator component aggregates 100 messages (which represent invoices) and then the Mapping component stores some context data (invoice numbers and customer ID) in the Application context, along with the request for the Web service invoker component is framed and forwarded.
- The Web Service component invokes a web service to get some customer details and looks up to a database to make some decision based on a Content Based Router component.
- Results are then written as a webpage and also stored in a database.
Tuning Process
Step 1
Estimate the configurations which will be used in the production scenario for the components and also the hardware on which the application will be hosted for production. Determine the production system load (with reference to the applications which may be already running in the system and available CPU cycles and Physical memory).
The following servers run on the test system:
- Fiorano Peer Server
- MY SQL Community Edition
- Tomcat Container with Axis hosting Web services for use by the application.
Hardware Configuration:
Windows XP Professional x86
JRE 1.5.0_18 with HOTSPOT off
Core2Duo processor 210GHz
Total Physical Memory - 4GB
Available physical memory - 2 GB
Virtual Memory - 2GB
CPU Usage - LOW below 15%
Step 2
Estimate the following metrics for each of the service components used in the Event Process. Define a logical time period to collect the metrics, so that the standard deviation is not too high for the averages computed. It could per hour, per minute or per day depending on the customer usage pattern. Let us refer to this time period as MC_TIME_INTERVAL in the notes below.
- Average number of messages [ANM] per MC_TIME_INTERVAL during peak usage hours.
- Maximum number of messages [MNM] per MC_TIME_INTERVAL during peak usage hours.
- Average size of the messages. [AVG]
- Maximum message size. [MAX]
When flow components like Aggregator, XMLSplitter, and Content Based Router (CBR) are used, metrics such as the Average number of messages and the maximum number of messages vary from component to component depending on the position they are in the application flow. When using other components that expect Input in one format and send output in another format, metrics like average message size and maximum message size tend to vary.
The number of messages for a particular service component can be found by applying the debugger (message interceptor) on the incoming routes on all the incoming ports. The debugger shows the count of messages coming into the component. The message size has to be determined by applying the debugger and copying the XML content (or binary content) into a temp file.
It is ideal to tune the application for the average settings, provided the standard deviation is not too high. The maximum memory settings should be high enough to accommodate stressful uses of the application.
For this particular sample walk-through, let us define these parameters as:
MC_TIME_INTERVAL = 1 minute
Parameter | FilePoller | XMLConverter | AggregateInvoices | TranformWCRequest | Customer Service Lookup |
|---|---|---|---|---|---|
ANM | 10 | 10 | 10 | 3 | 3 |
MNM | 30 | 30 | 30 | 10 | 10 |
AVG | 1KB | 1KB | 5KB | 500KB | 30KB |
MAX | 2KB | 2KB | 10KB | 1MB | 100KB |
Parameter | Insurance Rules Engine | ContentBasedRouter | StoreResults | CreateWebPage |
|---|---|---|---|---|
ANM | 3 | 3 | 2 | 1 |
MNM | 10 | 10 | 7 | 3 |
AVG | 300KB | 100KB | 100KB | 500KB |
MAX | 500KB | 500KB | 500KB | 500KB |
With the above metrics, you can calculate the operation Frequency from the number of messages given in the MC_TIME_INTERVAL.
Step 3
Once you have the above metrics, if any of the recommendations on the specific component provided by Fiorano fits the scenario under which the component is being used, it is possible to use these recommendations; for others, you can manually tune the memory settings for the component as described earlier in the documentation, observing the GC behavior and the Memory allocation graph.
Component Name | Type | Max Recommended Heap size | Min Recommended Heap size |
|---|---|---|---|
FilePoller | File Reader | 32 | 4 |
XMLConvertor | Text2XML | 32 | 4 |
AggregateInvoices | Aggregator | 64 | 16 |
TransformWCRequest | XSLT | 128 | 32 |
Customer ServiceLookup | WS Invoker | 64 | 16 |
InsuranceRulesEngine | DB | 128 | 32 |
ContentBasedRouter | CBR | 64 | 16 |
StoreResults | DB | 128 | 32 |
CreateWebPage | FileWriter | 64 | 32 |
|
| 704 MB | 184 MB |
Recommended Load on the test system:
85% of the physically available memory which is 1740 MB.