Launching eStudio
To start Fiorano eStudio application, perform the following actions:
Do any one of the following:
- Navigate to Fiorano Tools folder through Start menu and click Fiorano eStudio.
Navigate to $FIORANO_HOME/eStudio and run the eStudio executable file.
Workspace Selection dialog is shown prompting for the workspace directory. Workspace is a directory where all the repositories (Event Processes, Microservices and other metadata) are stored with the default workspace set to $FIORANO_HOME/runtimedata/eStudio/workspace.
The following preferences are stored in workspace preferences: wsLastUsedWorkspaces, wsRemember and wsRootDir.
- If the user chooses a workspace and selects the Remember Workspace option, and, if later, the Workspace Selection dialog box has to be shown, then this can be done by changing the value of wsRemember to false in the workspace preferences.
- When the Fiorano eStudio has completely launched, the user can switch between different workspaces. The option to switch the workspace is present at File -> Switch Workspace.
- The current workspace selected is shown in Fiorano eStudio title bar.
By default, eStudio is launched in Offline Event Process Development perspective and the offline repository is populated when eStudio is launched for the first time.
Understanding eStudio Views
There are various panels in eStudio, termed as views, which are meant to accomplish various tasks.
Event Process Repository
The Event Process Repository view is one of the views of the Offline Event Process Development perspective. To display this view, navigate through Window > Show View > Other > Fiorano > Event Process Repository.
Event Process Repository view shows all the event processes created in the Offline Event Process Development perspective, under various categories.
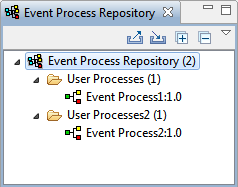
Figure 1: Event Process Repository
Fiorano Orchestration
Offline and Online Event Process Development perspectives are comprised of an editor area called Fiorano Orchestrator. When an Event Process is opened (double-click the Event Process), the design of the event process is shown in the Fiorano Orchestrator where further editing can be done.
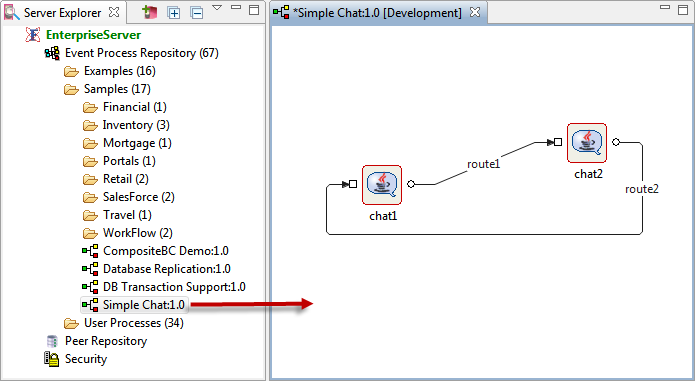
Figure 2: Orchestration Editor
Micro Service Palette
The Micro Service Palette shows the microservices that are present in the eStudio repository. The Micro Service Palette contains all the Fiorano microservices grouped into various categories such as: Bridges, Collaboration, DB, Error, File, and so on as shown in the figure below.
To display Properties view, navigate through Window > Show View > Other > Other > Micro Service Palette.
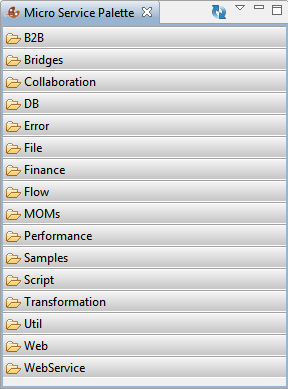
Figure 3: Fiorano Micro Service Palette
Properties
The Properties view displays all the property names and values for any selected item such as: a microservice instance, route, port, and so on.
To display Properties view, navigate through Window > Show View > Other > General > Properties.
Placing the cursor on a property shows the property description.
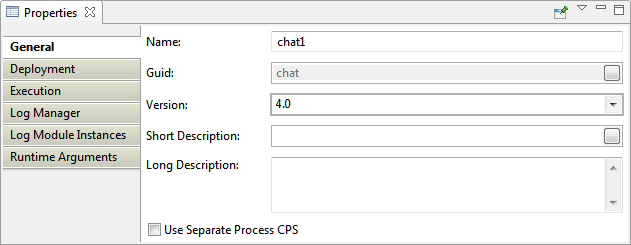
Figure 4: Properties view
Problems
While working in the Fiorano environment, the errors and warnings occurred are displayed in the Problems view. For example, when an Event Process containing errors is saved, the errors are displayed in the Problems view.
To display Problems view, navigate through Window > Show View > Other > General > Problems.
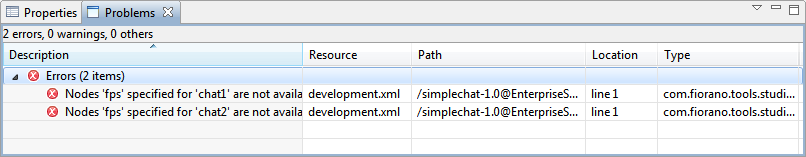
Figure 5: Problems view
By default, the problems are grouped by their severity level. The grouping can be selected using the Group By menu in the drop-down present at the upper-right part of the Problems panel.
Problems view can also be configured to show the warnings and errors associated with a particular resource or group of resources. This is done using the Configure Contents option in the drop-down menu.
Additionally, you can add multiple filters to the Problems view and enable or disable them as required. Filters can either be additive (any problem that satisfies at least one of the enabled filters will be shown) or exclusive (only problems that satisfy all of the filters will be shown).
Error Log
The Error Log view captures all the warnings and errors logged in the Fiorano environment. The underlying log file (.log) is stored in the .metadata subdirectory of the workspace. The Error Log view is available under Window > Show View > Other > General > Error Log.
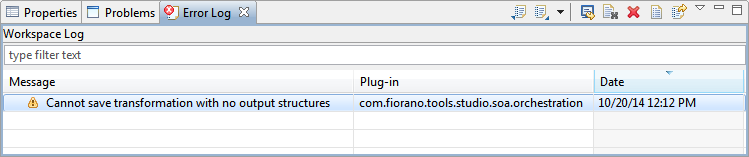
Figure 6: Error Log view
Service Repository
Fiorano eStudio provides a Service Repository view which shows a categorized list of all available microservices. When the Fiorano eStudio is launched for the first time, the offline repository will be loaded from the installer.
Microservices which are available only in the Service Repository can be used for composing event processes in eStudio. Microservices can be imported from or exported to a file system or a Fiorano ESB Server from the Service Repository.
To open this view, navigate through Window > Show View > Other > Fiorano > Service Repository.
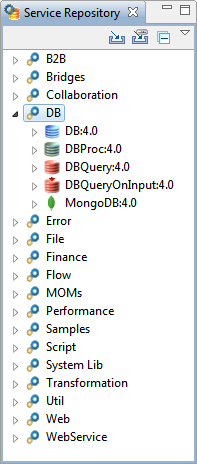
Figure 7: Service Repository
Project Explorer
The Project Explorer view lists all the projects in eStudio. All the Event Processes, Microservices and Mapper projects are shown in the Project Explorer view.
To use Version Control, corresponding plug-ins have to be added in drop-ins. If the drop-ins are added, then the version control options will be available in the context menu of a project in this view.
To open Project Explorer view, navigate through Window > Show View > Other > General > Project Explorer.
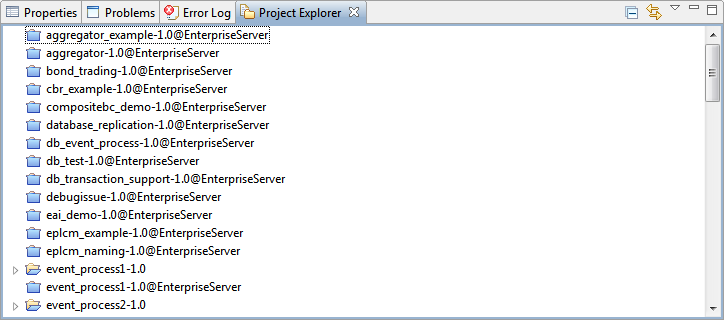
Figure 8: Project Explorer
The microservice projects are shown as closed projects by default. You can open a project by right-clicking on a project and by selecting the Open Project option. For performance reasons, it is advised to close the microservice projects when they are not being used.
Server Explorer
The Server Explorer view shows the Enterprise servers, which contains Event Process Repository and Peer Repository nodes. The Event Process repository is centrally stored in the Enterprise Server. The Enterprise Server provides API access to the event processes such as to save, view, export, launch, debug, stop, and similar actions as required. The Fiorano eStudio provides an easy-to-use GUI to manage event processes. The Peer Repository shows the peer servers connected to the Enterprise Server.
To open the Server Explorer view, navigate through Window > Show View > Other > Fiorano > Server Explorer.
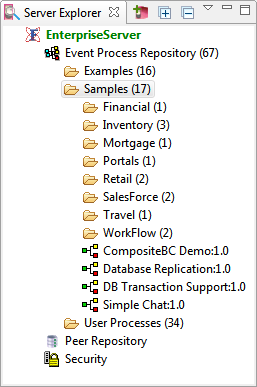
Figure 9: Server Explorer
Fiorano Debugger View
The Fiorano Debugger view shows the list of routes on which debugger is enabled and messages trapped within each route. This gives you the ability to take action on debug message.
To open the Fiorano Debugger view, navigate through Window > Show View > Other > Fiorano > Fiorano Debugger.
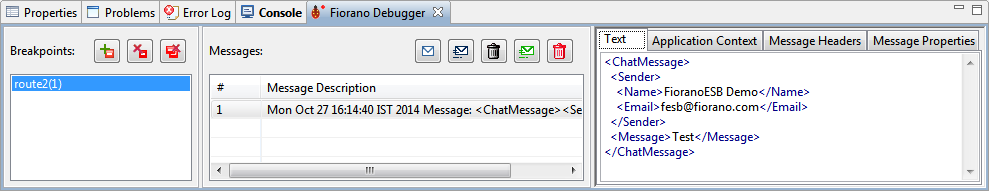
Figure10: Fiorano Debugger view
Service Descriptor Editor
Microservices can be edited using a Service Descriptor editor.
To edit a microservice in the Service Descriptor editor, right-click the desired microservice in Micro Service Palette or in Micro Service Repository and click the Edit option from the context menu.
Attributes of Service Descriptor are divided into three categories:
- Overview – Contains general information about the microservice like Name, GUID, version, icon etc.
- Execution – Contains information about microservice ports, runtime arguments, launch options and log configuration.
- Deployment – Contains information about microservice resources, dependencies and general deployment information.
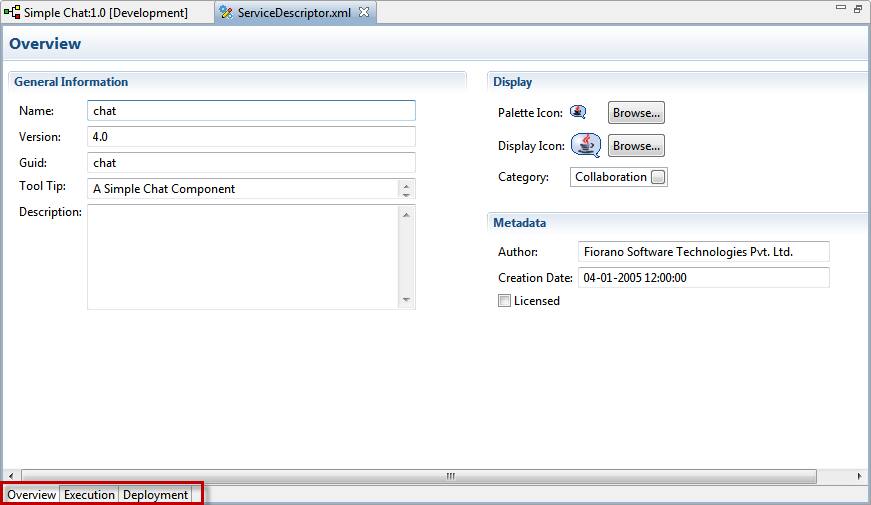
Figure 11: Service Descriptor Editor