After creating API project and configuring/adding policies in its resource, click the Debug ![]() icon present on the menu bar to open Debug view. The Debug view allows to intercept a message at various points of policy execution and thereby helps to analyze/modify the message at the respective break point. Preferred resource and environment can be chosen from the Select a resource to debug and Environment drop-downs respectively.
icon present on the menu bar to open Debug view. The Debug view allows to intercept a message at various points of policy execution and thereby helps to analyze/modify the message at the respective break point. Preferred resource and environment can be chosen from the Select a resource to debug and Environment drop-downs respectively.
After choosing the resource, the project policies and resource policies are displayed in its respective scopes (see Figure 1). If there are no environments to choose, deploy the API project.
The message panel respective to the environment selected will be displayed at the bottom part of the screen. This message panel reflects the variables configured in the Documentation page.
Adding Breakpoint
Right-click the route where the message has to be intercepted and click the Add Breakpoint option.
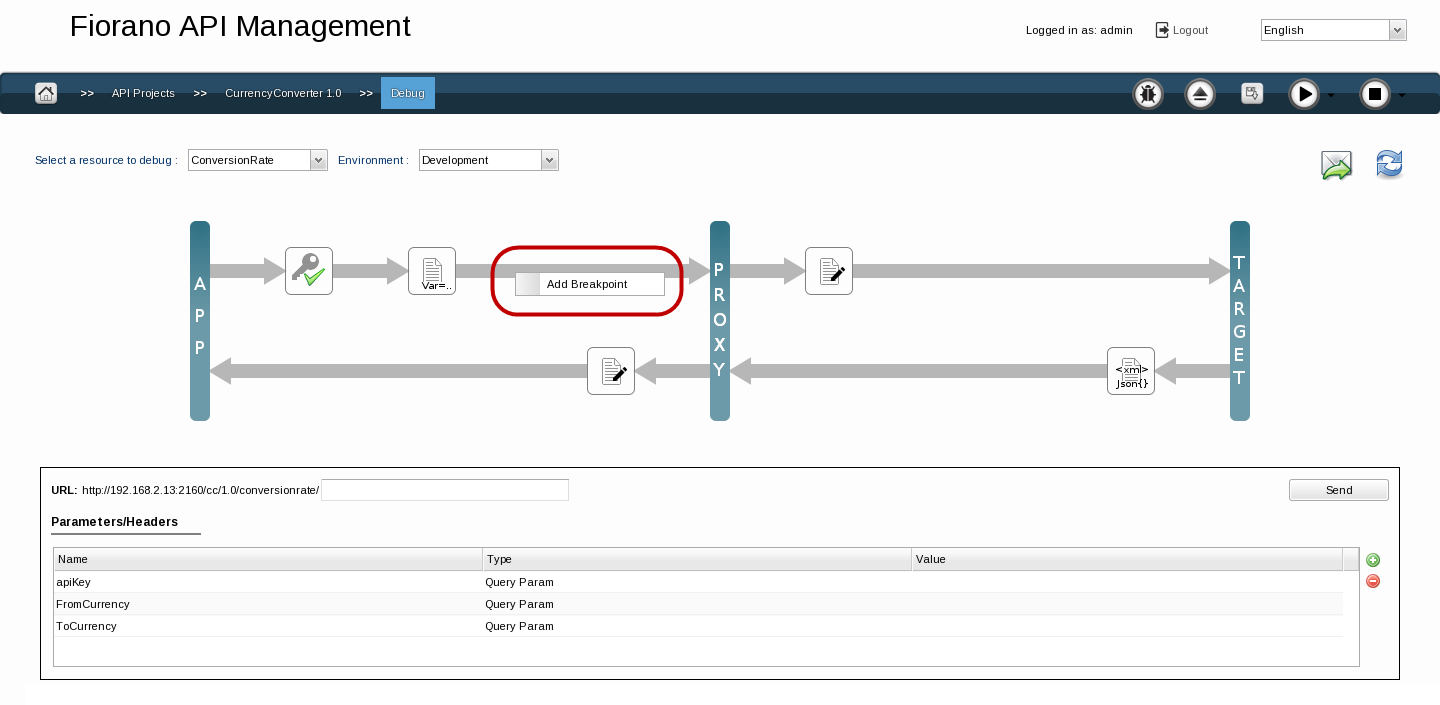
Figure 1: Adding breakpoint
Color of the route turns red representing the breakpoint.
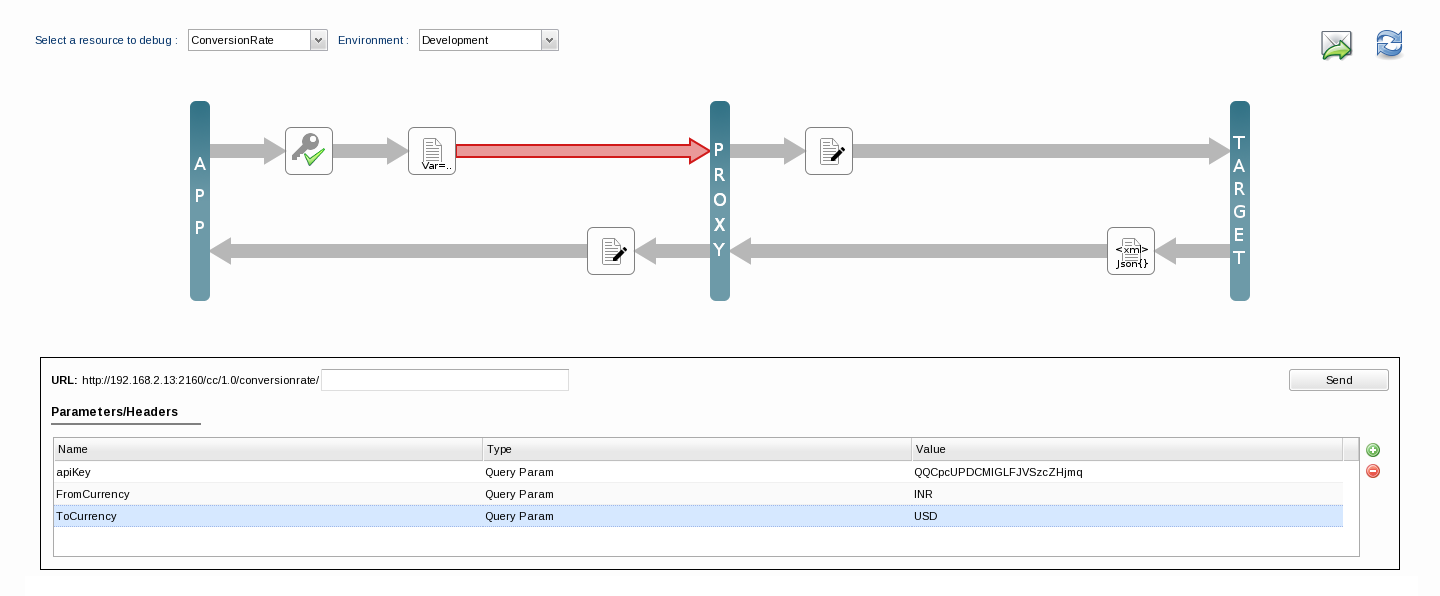
Figure 2: Route on which breakpoint is set turning red
Debugging
To start debugging, first enter the values of parameters in the Message panel following the descriptions as provided in the Documentation page. After entering the values, click the Send button present at the upper-right part of the Message Panel as shown in Figure 2. The message is intercepted at the first breakpoint and the route starts blinking in green color and the message at that breakpoint is shown in the Response Message panel.
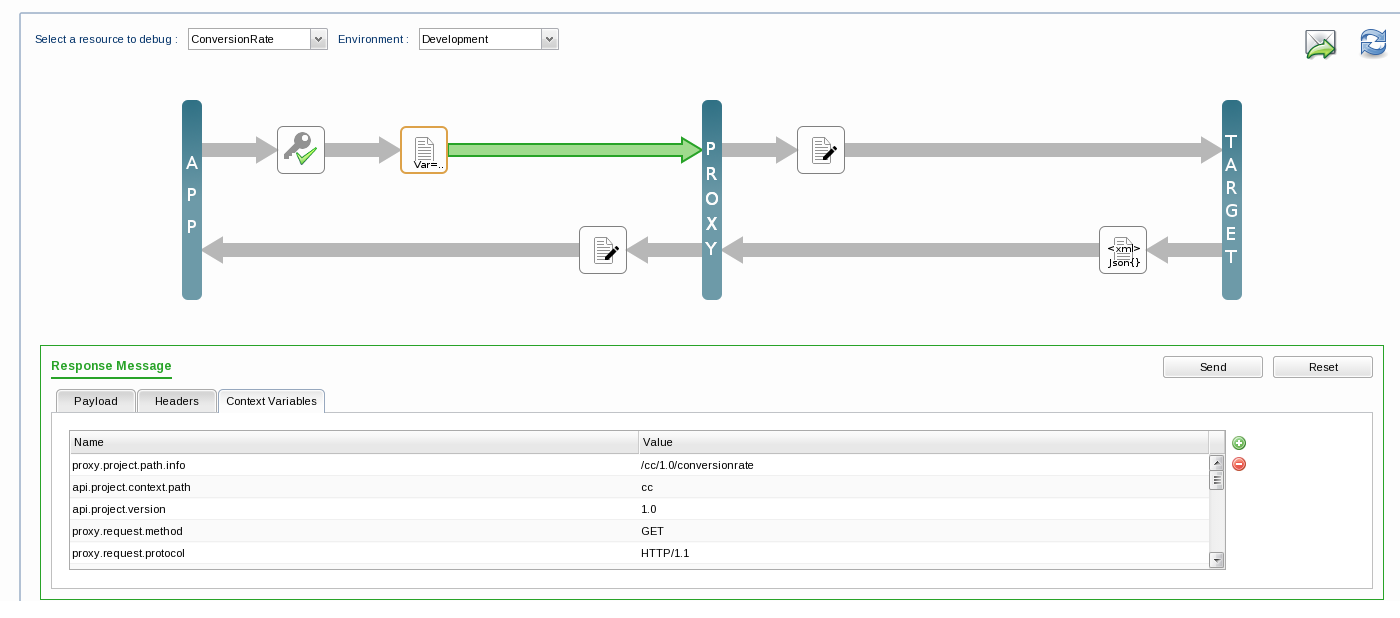
Figure 3: Route turning green in colour and response message appearing below while debugging
In the Response message panel, the details can be edited to be sent. Reset button present next to the Send button helps to reset the changed details.
After sending messages from all the breakpoints or after every policy execution, the final response is sent to App End point and it turns green.
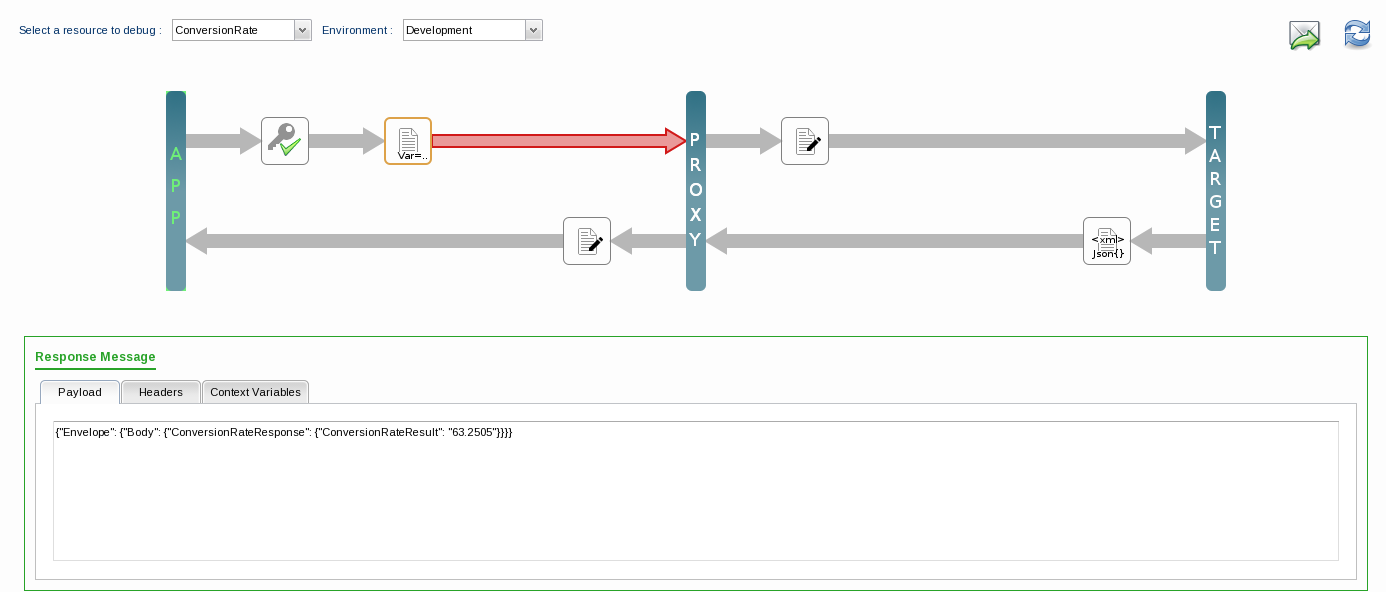
Figure 4: APP displayed in green font on receipt of the final response
Errors in Debugging
If an error occurs while executing a policy, the border of the policy node turns red and the debug process is stopped to send the response/error message directly to App end point.
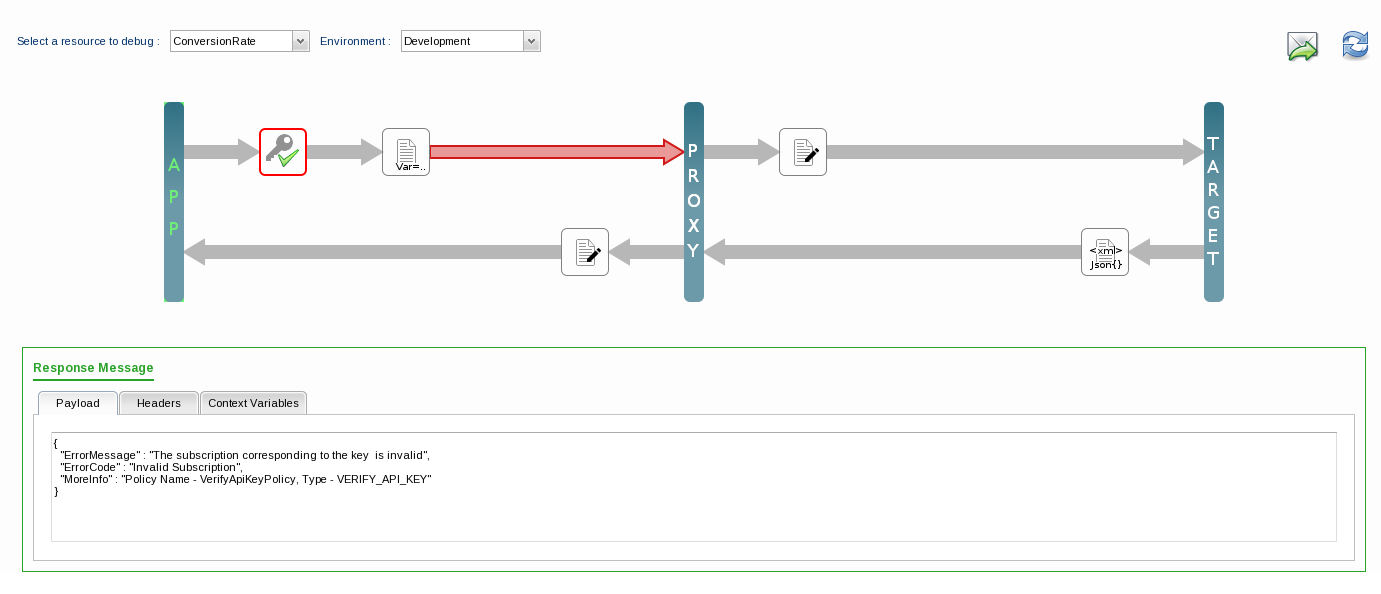
Figure 5: Border of the Policy node turning red indicating error in policy
If an error occurs in target end point, it turns red and the response/error message is sent directly to App end point. The error message can be seen in response message received.
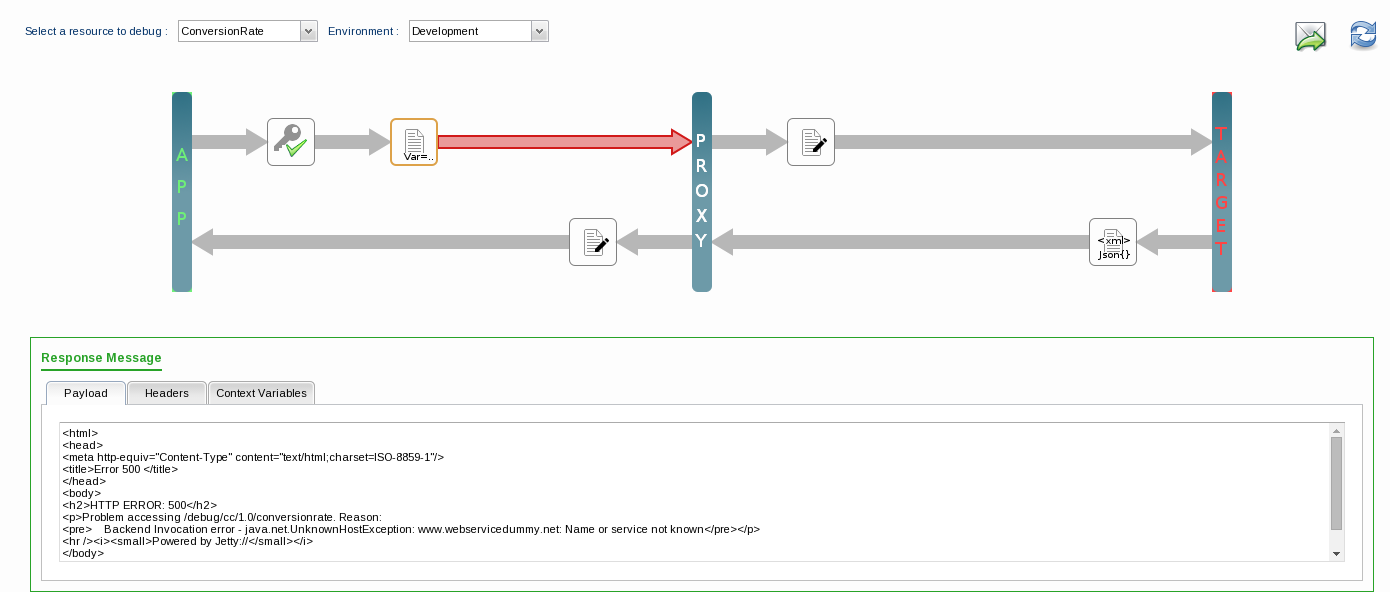
Figure 6: TARGET displayed in red font indicating some error on target end point and error message displayed as response message
Ignored Policies
While policy execution, if the rule of the policy is not satisfied, the policy is ignored and its border turns orange as shown in Figure 6. The policy details of the ignored policy are shown in Figure 8.
Reinjecting Message
Click the ![]() icon present at the upper-right corner of the screen. Message panel appears to start over the debug process again as shown in Figure 2.
icon present at the upper-right corner of the screen. Message panel appears to start over the debug process again as shown in Figure 2.
Refetching an API Project
Click the refresh ![]() icon on the top right to refetch API project and reload the debug panel.
icon on the top right to refetch API project and reload the debug panel.
Removing Breakpoint
Right-click the route in which breakpoint is set and select Remove Breakpoint; the route color turns to default color.
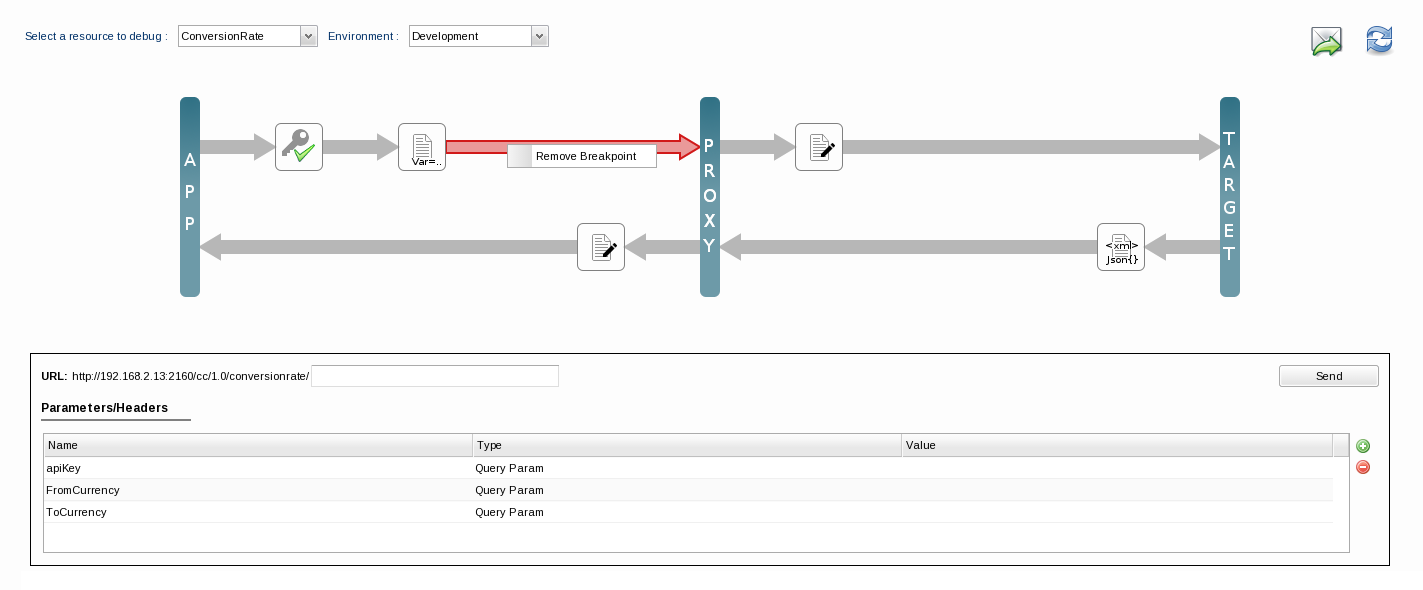
Figure 7: Remove Breakpoint option to remove the breakpoint set
Policy Details panel
Click the policy node to view the policy details.
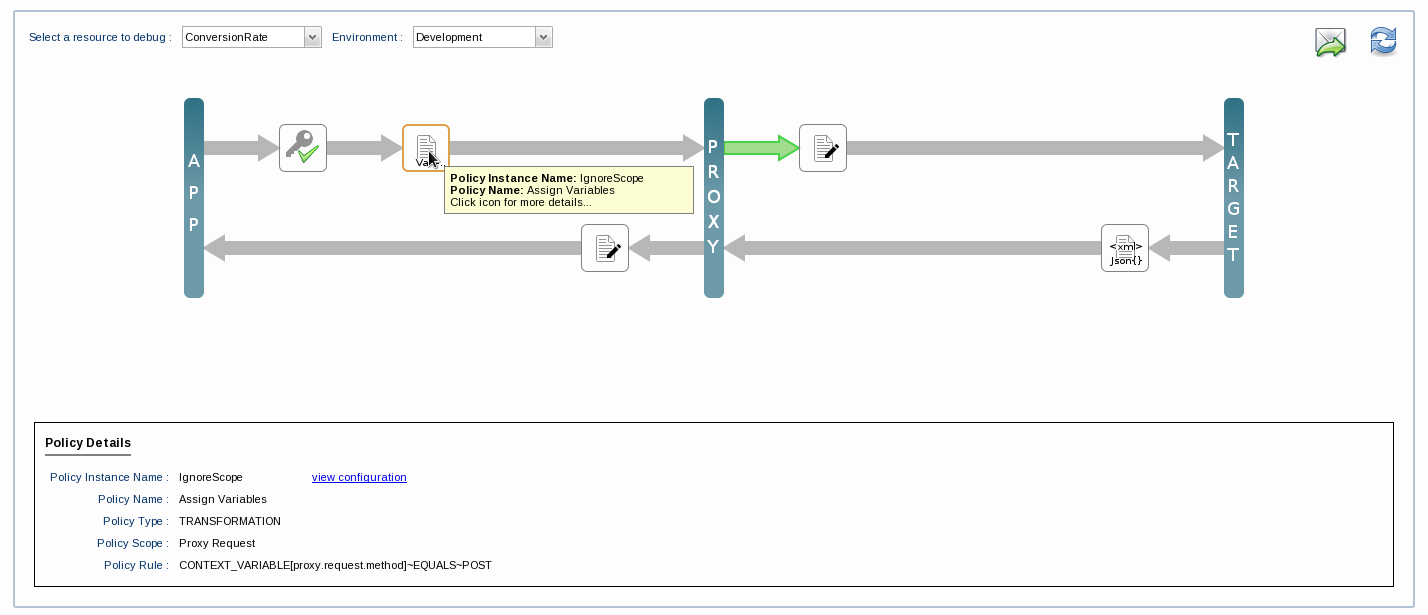
Figure 8: Policy Details