...
You can monitor the performance of services by enabling monitoring in the monitor performance in respective component CPS. Performance statistics is shown in two views :- Data View and Graph View.
| Note |
|---|
To monitor user Events, you need to enable a parameter - ListenForUserEvents in FES profile. This can be done from eStudio Profile Manager or from the Dashboard. Refer the Enable ListenForUserEvents parameter for Monitoring Performance section to read through the steps. |
Data View
This view shows performance messages sent by components in data form. You have the choice to select the components for which monitoring data should be displayed. Also, the time-interval for which monitoring data is displayed can be configured.

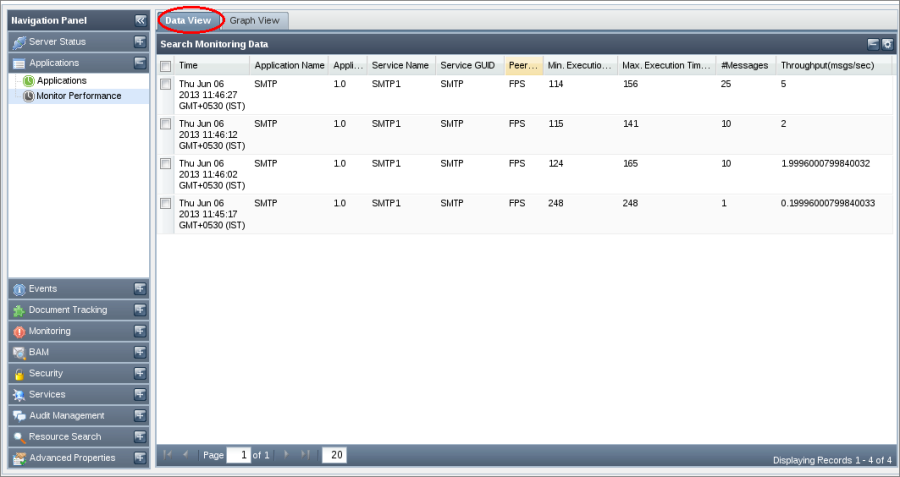
Figure 8: Data View tab
...
| Note |
|---|
Only one component can be monitored at a time in Graph View. |

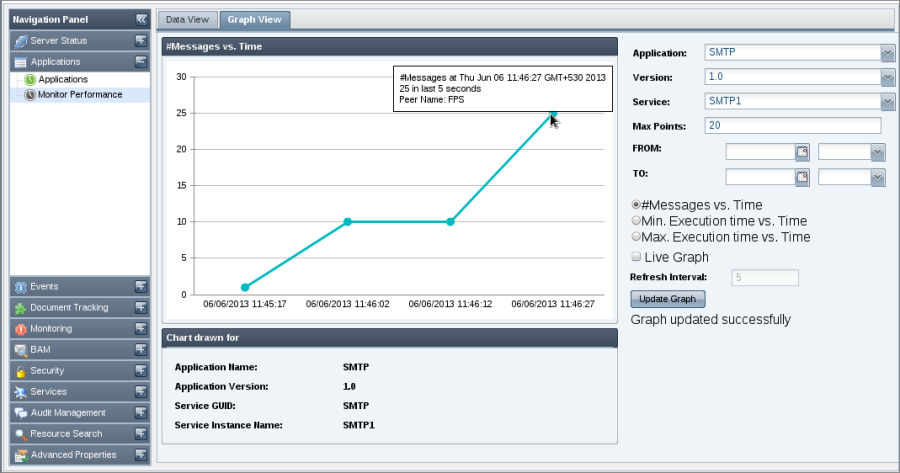
Figure 7: Graph View
...