...
- Username: admin
- Password: passwd.
Figure 1: Fiorano Web Console Login Page
...
Server Status tab shows the details of the available Fiorano Servers. The top view shows the running status, memory usage and CPU Utilization. Further details are available on clicking the server links, which loads the bottom view with the following details:
...
Server Details
Displays the basic details of the server. Click the server name present under Server column to display the details under Server Details tab below.
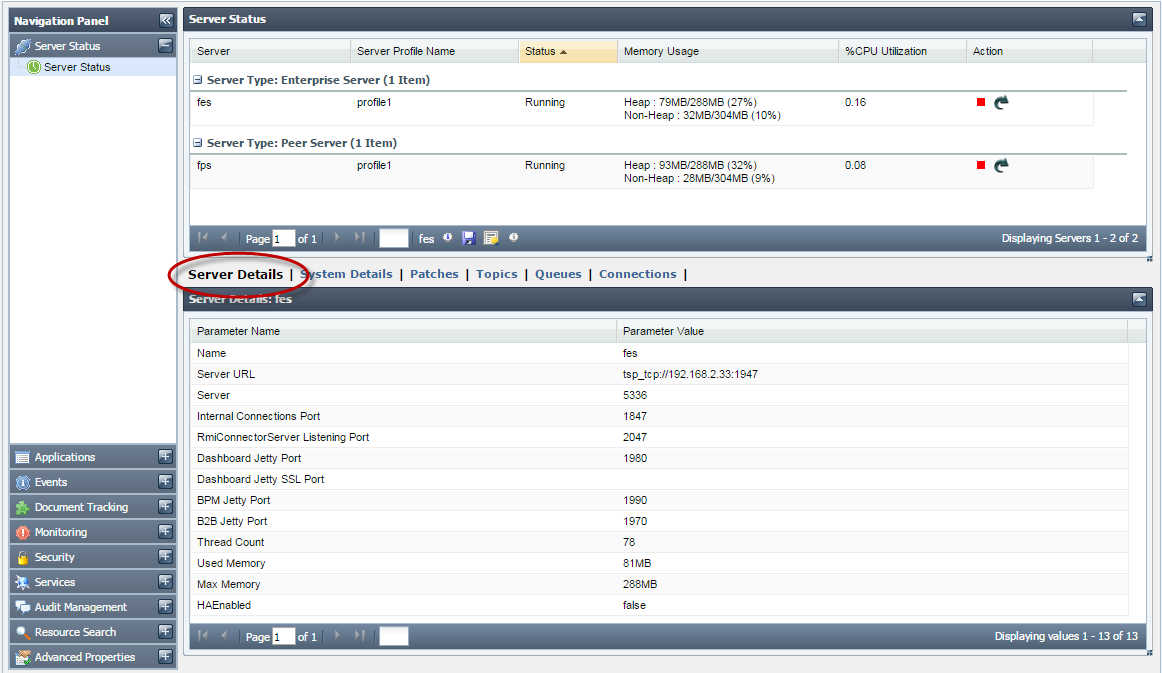
Figure 2: Server Status tab showing FES details
System Details
O/S and JVM statistics of the server
...
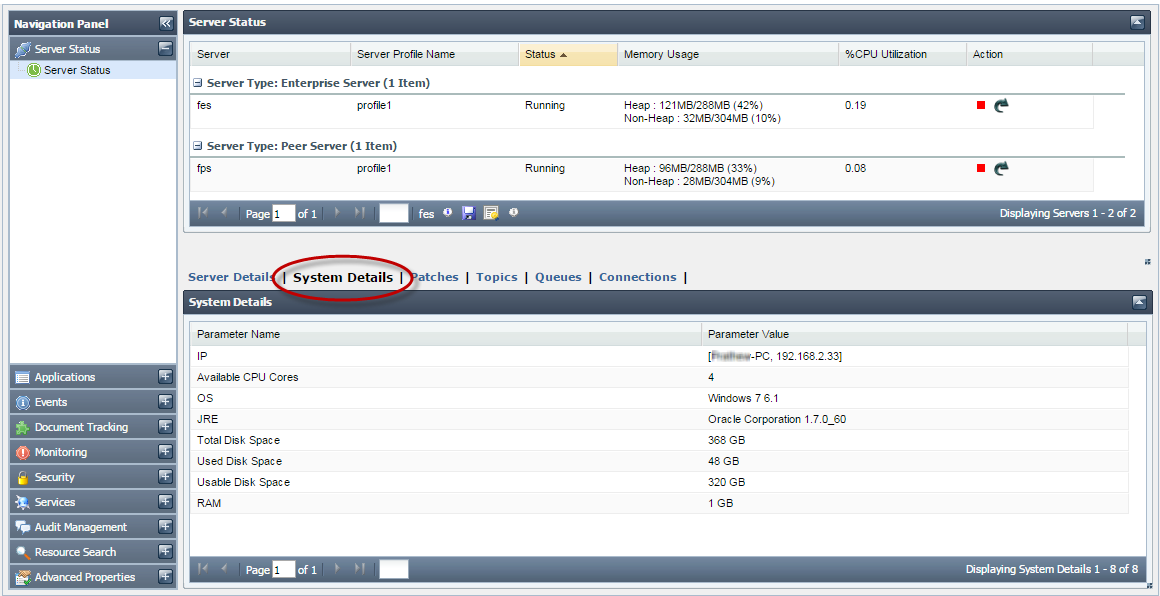
Figure 3: Server Status tab showing System details
Topics
List of JMS topics
...
present in the server
...
.
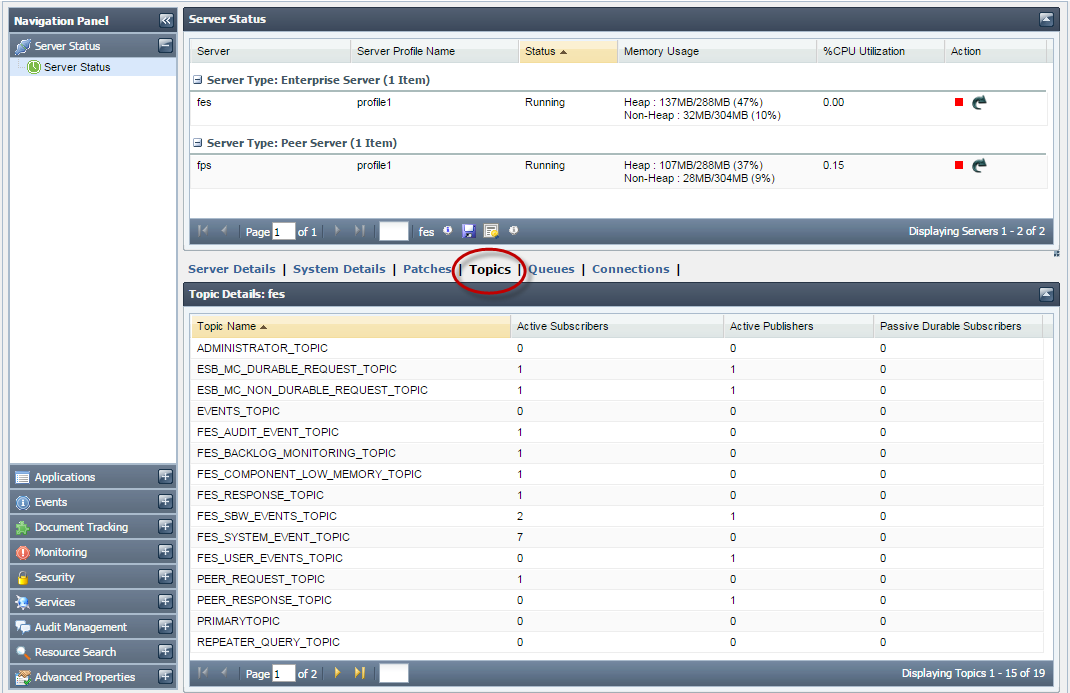
Figure 4: Server Status tab showing topics created by FES
Queues
List of queues present in the server.
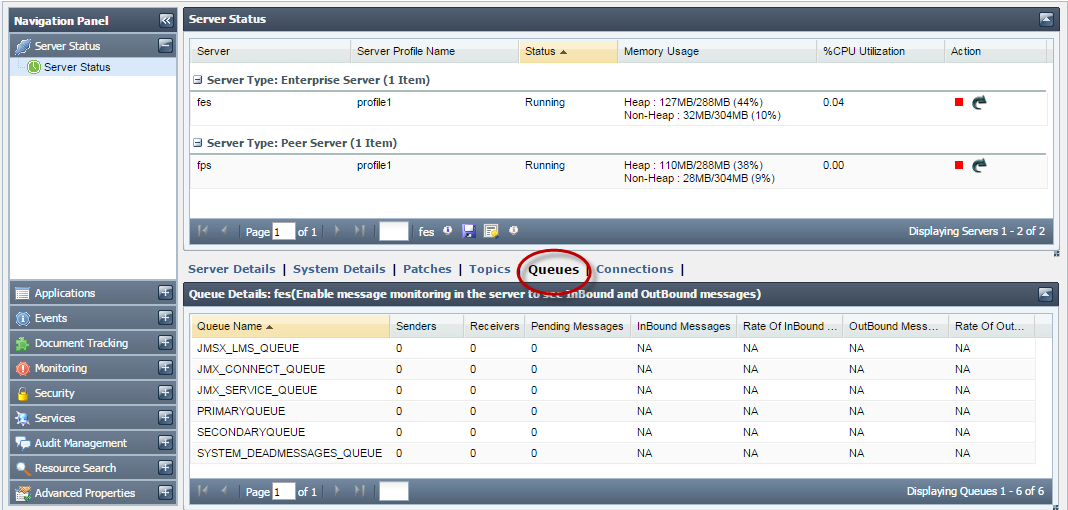
Figure 5: Server Status tab showing queues created by FES
| Note |
|---|
To track messages in the Queues section, enable the EnableMessageMonitoring property under QueueingSubSystem node in the Peer Server. Refer the Enable Message Monitoring in the View Message Monitoring Logs section to see how to enable this from the Profile Manager perspective. |
...

Figure 2: Server Status tab showing System details

Figure 3: Server Status tab showing topics created by FES
...
Connections
List of connections created by the server.
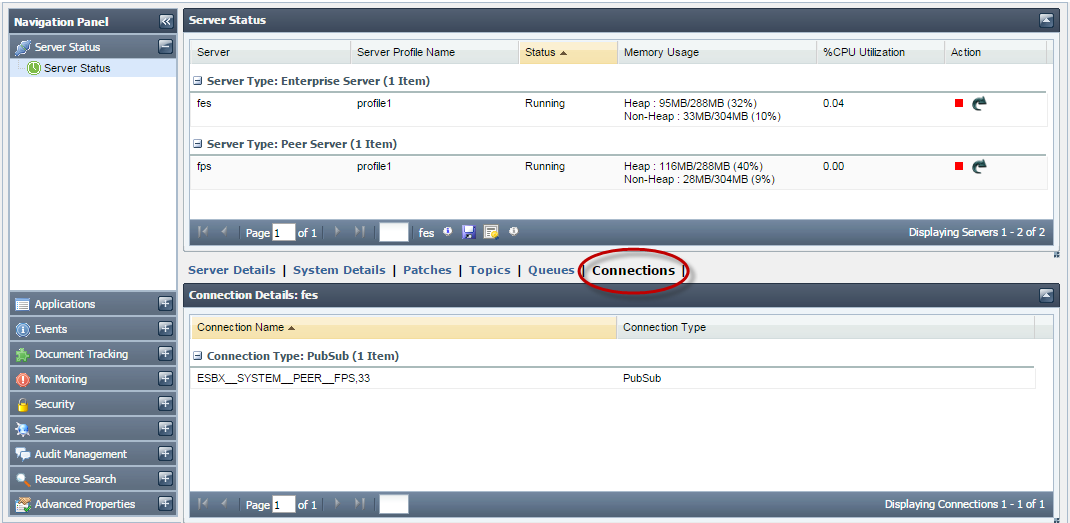
Figure 6: Server Status tab showing connections created on FES
...
This section shows the details of the event processes running on the Fiorano Peer Server. The top view shows the list of event processes saved in the Fiorano Server. It also shows the details like running status, category and the Peer servers used. By clicking on the link for each event process, you get the details of the Service Instances running as part of it. This page also provides capabilities to launch, stop, restart an event process or its components, View Output and Error logs, and Export logs (These features is disabled if event process is in debug mode). The details for the services are displayed in the bottom view. This includes:
- Service Instance Name - Service components in the event process
- Service GUID - Service GUID of the component
- Version - Version of the component
- Status - Displays whether the component is running or not
- Running on Peer - Name of the peer server on which the component is launched
- Launch Type - Displays whether the component is launched as a separate process, in-memory or manual.
- Memory Usage - Displays memory usage for CCP enabled components
- Process ID - Displays process id for CCP enabled components which are executed as separate process

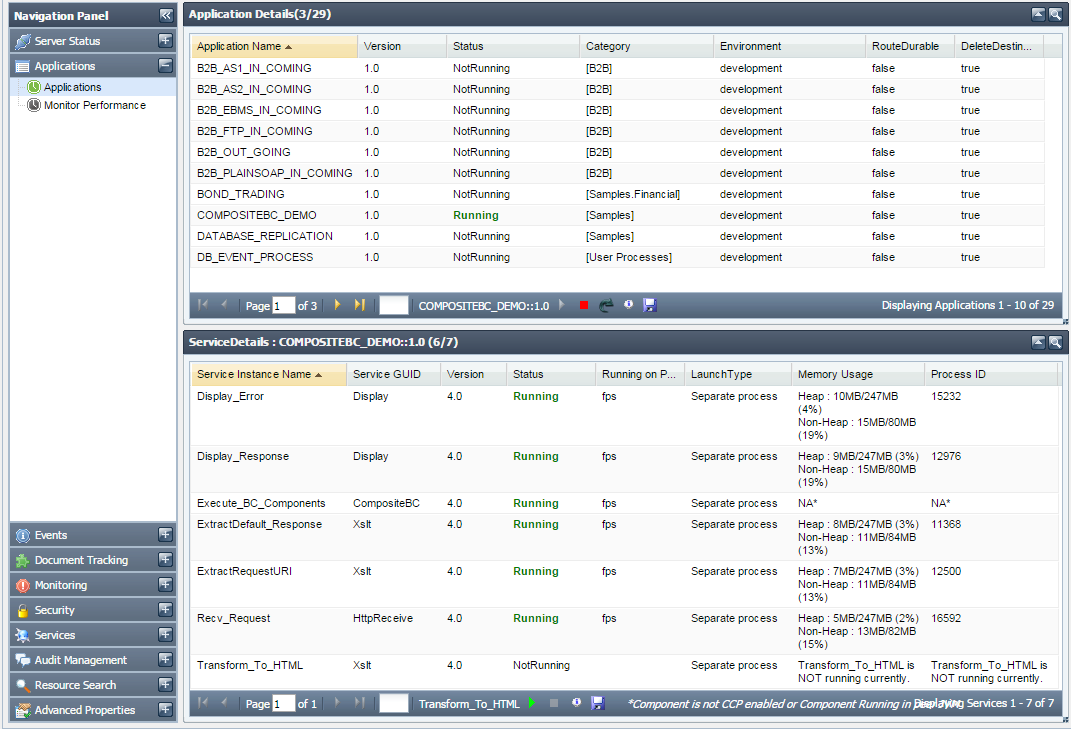
Figure 57: Applications Tab showing the details of the applications
...
You can monitor the performance of services by enabling the monitor performance in component CPS. Performance Performance statistics are is shown in two views:
Data View
This view shows performance messages sent by components in data form. You have the choice to select the components for which monitoring data should be displayed. Also, the time-interval for which monitoring data is displayed can be configured.

Figure 68: Data View tab
Graph View
Performance of the a component is represented in a graphical form. Graphs can be monitored for archived performance data or for the latest data. To show latest performance data, select Live Graph option. Maximum number of points plotted on the graph can be configured by specifying desired value for the Max Points field. It is recommended to use Firefox 2.0 or Internet Explorer to see Graph View.
| Note |
|---|
Only one component can be monitored at a time in Graph View. |

Figure 7: Graph View
...