...
Each service component has to be tuned to achieve high performance and stability. There cannot be strict recommendations on the heap memory usage for components, as the memory usage of a component is highly dependent on the "context" in which it is used. The Context could be the physical hardware like the number of processors/physical memory size, the configuration with which the component is running, the size of the incoming message, the frequency of service invocation, JVM specific parameters like the version, type of JVM (32 bit/64 bit), the JVM garbage collection algorithm and other memory competing software(s) running on the system and, finally, in some cases the internal implementation of the component itself.
This document makes some recommendations for components running under preset contexts. These recommendations should be considered as guidelines and ideally, the tuning process has to be done based on the general guidelines outlined herein along with the specific instructions for each service component instance.
...
The definition of a server-class machine applies to all platforms with the exception of 32-bit platforms running the Microsoft Windows operating system. On all other platforms, the default values are the same as the default values for JDK version 1.4. The following table illustrates the choice of the machine class for common platforms and Operating system combinations.
...
The -Xmx and –Xms settings can be set for a particular Fiorano component as part of the JVM_PARAMS runtime parameters attributes as illustrated in Figure 1. Multiple JVM runtime parameters can be added and separated with by a space as a delimiter. The Heap Size setting should be set in the following format: –Xmx[value][[optional]mem_char]. By default, all specified values are measured in bytes. You can append the letter `k' or `K' to the value to indicate kilobytes, `m' or `M' to indicate megabytes, and `g' or `G' to indicate gigabytes. This attribute is a common attribute for all service components.
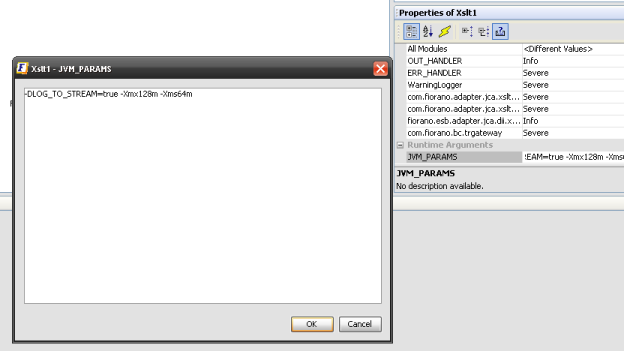
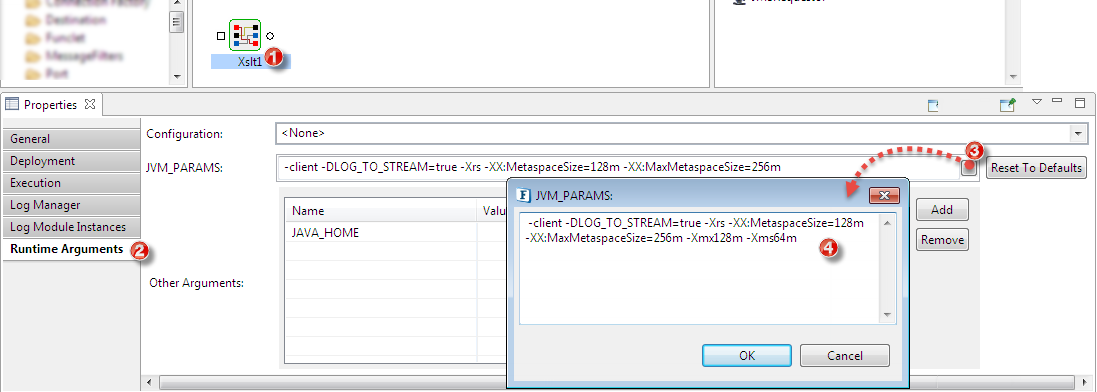
Figure 1: Setting the JVM _PARAMS attributes of a Component Instance
...
Garbage collection is a process of releasing the memory currently allocated by unused java objects in the Heap Space. The Heap Space contains all the objects created in the Java program. When an object is no longer used by any of the pointers, the object is garbage and it can be released. The recommended values for -Xmx and -Xms largely depend on the load/size of the messages processed by the component and other component implementation-specific parameters. The JVM heap size specified for the component determines how often the VM collects garbage and how much time it spends on each garbage collection sweep. An acceptable rate for garbage collection is application-specific. It is generally recommended that the JVM spends significantly less than 30% of its time on garbage collection; this time should be adjusted after analyzing the actual time and frequency of garbage collections. The goal of tuning the heap size is to minimize the time that it spends doing garbage collection while maximizing the number of messages that the component can handle at a given time. It is recommended that the following factors are analyzed for the optimum setting of the Xmx and Xms parameters:
...
- Run the Netbeans Profiler Calibration
- Configure the Netbeans profiler
- The Profiler task should be to analyzing memory usage
- It is recommended that the Profiler is setup on a different machine than the machine on which the Fiorano Peer Server is installed , because profiling in itself is a CPU-intensive, memory consuming task.
- Netbeans provides the runtime arguments to be added to the external application on launch. Copy the parameters as specified and as required into a text editor.
- Configure the Fiorano component runtime parameters. Add the copied runtime arguments from step 2 (c) above to the service component JVM_PARAMS runtime argument as shown in figure 2
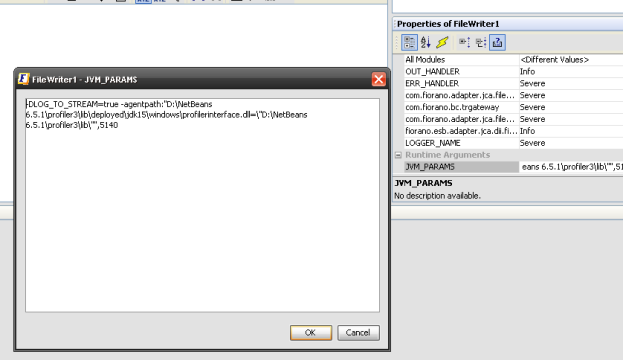
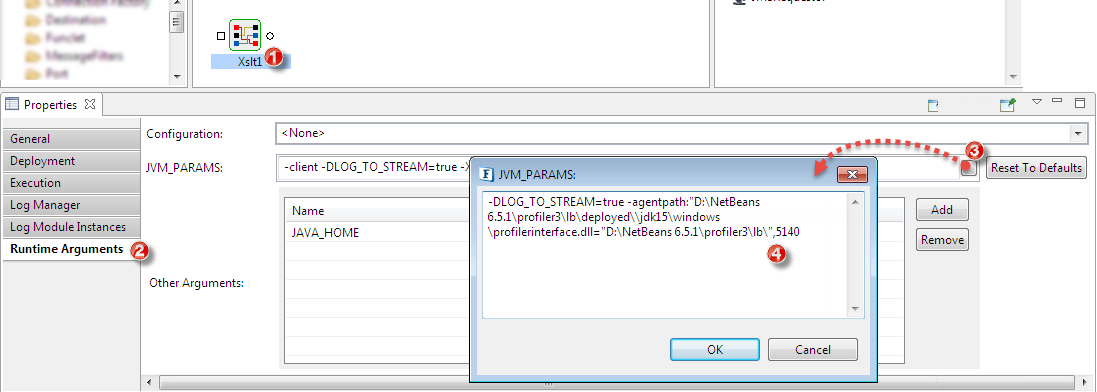
Figure 2: Adding the profiler settings to the JVM_PARAMS - Launch the component/application. Note: the component will not start until the Profiler is attached to the Java process.
- Attach the Netbeans Profiler. The profiler should start collecting the statistics on heap memory usage together with the garbage collection statistics. Switching to VM telemetry view is needed.
...
It is recommended that the production environment be is simulated to determine how the component/application is typically used before one starts tuning memory settings. Once the component is running and the profiler is attached an analysis can be performed to determine whether a component is stable, suffocated, dangerous or well tuned, as described in the sections that follow.
...
The graph of figure 3 below suggests that the memory utilization of a component after the initialization of a very minimum heap size , shoots up to a specified level and remains at that level even after you have requested a Full System Garbage Collection (Using Netbeans). (Note: Java does not guarantee that Garbage collection will happen if the command is executed, but there is a good change chance it does for the most part). Such a level is a good recommendation for the Xms setting of the service component. The service component memory usage is stable under the tested scenario and it is recommended that the Xmx and Xms settings be set to values on the upper bound and lower bound of the graph respectively.
...
Figure 4 graph suggests that the actual actually used heap memory reaches the allocated heap memory too often and when the allocated heap memory is below the Maximum memory setting, a partial garbage collection is done on the Eden space (younger generation) of the heap space; this is fine as long as the Eden space is kept at low number (default not modified), but if the allocated heap memory in the above case is set to the Maximum memory, a full System garbage collection is issued, which ideally should not occur too often. When the graph shows steep peaks too often as illustrated in figure 4 and if the allocated heap size is close to the maximum memory utilization of the component JVM, then it is recommended that the allocated heap space should be increased.
...
It is typically the case that most users tune a component with a very high heap Memory setting for the best performance since the frequency with which garbage collection happens will then be very low and most processor time for the JVM is dedicated to the component. This is a good option when it is possible to calculated calculate or known know for certain the component does not reach the maximum memory limit or, if it does reach the maximum memory limit, that the time then taken for garbage collection is acceptable. Because the heap memory limit is very high, the Garbage Collection process takes proportionately longer. So a downside of setting a high upper limit on the heap space for a component instance is that the Garbage Collection Process can sometime sometimes take an inordinate amount of time. This can have some repercussions as discussed below:
The distinct plateaus in the garbage collection statistics of figure 5 above suggest that for the length of each plateau a full GC has been running which is generally a "Stop the World" process, making the component unresponsive for that length of time. A long lengthy garbage collection process can lead to several complications as there can be a random/ considerable amount of delay in the processing time of the component. More importantly, the JMS connection made by the component to the Fiorano Peer Server to which it is connected could be invalidated depending on the ping timeout set on the connection parameter which might cause the component to stop execution or kill itself.
...
A well-tuned component, as illustrated in figure 6, neither performs garbage collection very frequently nor does it take an unacceptable amount of time performing garbage collection. The heap memory size does not shoot up or come down drastically at any point. It is generally quite stable increasing from the minimum heap size to the maximum heap size and then back to the minimum heap size, which should be the amount of memory needed by the component.
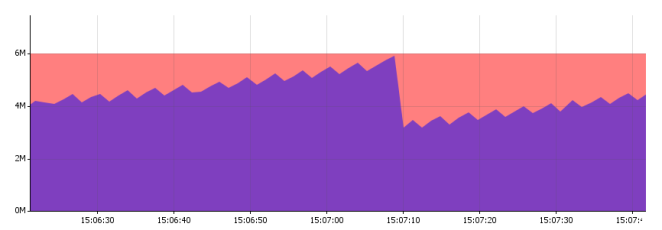
Figure 6: A well-tuned component
As shown in figure 7, the garbage collection graph displays uniform behavior below the 30 % mark and there are no high peaks for an extended period of time. This balance is very important to strike for every Fiorano service component instance.
...
So if your computer has 4 GB RAM, and 2 GB RAM is being set as the page file size, then available Virtual memory is 6 GB RAM and 75% of this value is 4.5 GB. If the Fiorano Peer Server and Fiorano components total of the maximum heap sizes is are close to 4.5 GB, then this indicates that the "Architectural Limit" has been reached. Loading memory over this limit does not guarantee a stable Fiorano environment.
...
If the component is launched within the same JVM as the Fiorano Peer Server, the libraries and classes loaded by the peer servers and other components launched in-memory are shared. Since there is no separate process, the JVM does not need to create a separate stack space as the memory spaces are shared between the component and the Fiorano Peer Server. In this case, there will only be an increase in the heap space of the Fiorano peer server. The Peer Server JVM has to be re-tuned each time a new component is launched in-memory. For Fiorano Peer Server, use the same procedure to tune the memory settings as discussed in the previous sections for components.
...
XSLT is a component that executes a an XSL and converts XML from one format to another. The memory utilization of this component depends on:
...
| Anchor | ||||
|---|---|---|---|---|
|
The Content based router (CBR) is used to route messages to different routes based on the XML content of the message. The routing logic is based on applying an XPath selector over the incoming message. The following factors determine the setting of an optimum Heap space for the CBR component:
...
Fiorano does not recommend turning the persistence off if the aggregation size is going to be more than 5 MB. The Aggregator uses DOM-based data structures for internal processing of XMLsXML files, and these structures typically utilize memory approximately 3-10 times the size of the input file. The memory required by the component in case of message persistence is set to no, thus directly proportional to the Aggregation size. The following factors determine the amount of heap memory taken up by an Aggregator Component:
...
- Pick up a CSV (Comma Separate Variable, text file) Insurance Request file from a Directory location and send the file contents to a Text2XML Converter.
- The Text2XML Converter converts the incoming file into XML and then sends the XML packet to an aggregator component.
- The aggregator component aggregates 100 messages (which represent invoices) and then the Mapping component stores some context data (invoice numbers and customer ID) in the Application context, along with the request for the Web service invoker component is framed and forwarded.
- The Web Service component invokes a web service to get some customer details and looks up to a database to make some decision based on a Content Based Router component.
- Results are then written as a webpage and also stored into in a database.
| Anchor | ||||
|---|---|---|---|---|
|
...
When flow components like Aggregator, XMLSplitter, and Content Based Router (CBR) are used, metrics such as the Average number of messages and the maximum number of messages vary from component to component depending on the position they are in the application flow. When using other components that expect Input in one format and send output in another format, metrics like average message size and maximum message size tend to vary.
The number of messages for a particular service component can be found by applying the debugger (message interceptor) on the incoming routes on all the incoming ports. The debugger shows the count of messages coming into the component. The message size has to be determined by applying the debugger and copying the XML content (or binary content) into a temp file.
...
Recommended Load on the test system:
85% of the physical physically available memory which is 1740 MB.