...
| Tip |
|---|
Refer to the Re-injecting Failed Documents page to understand more about failed documents and re-injection. |
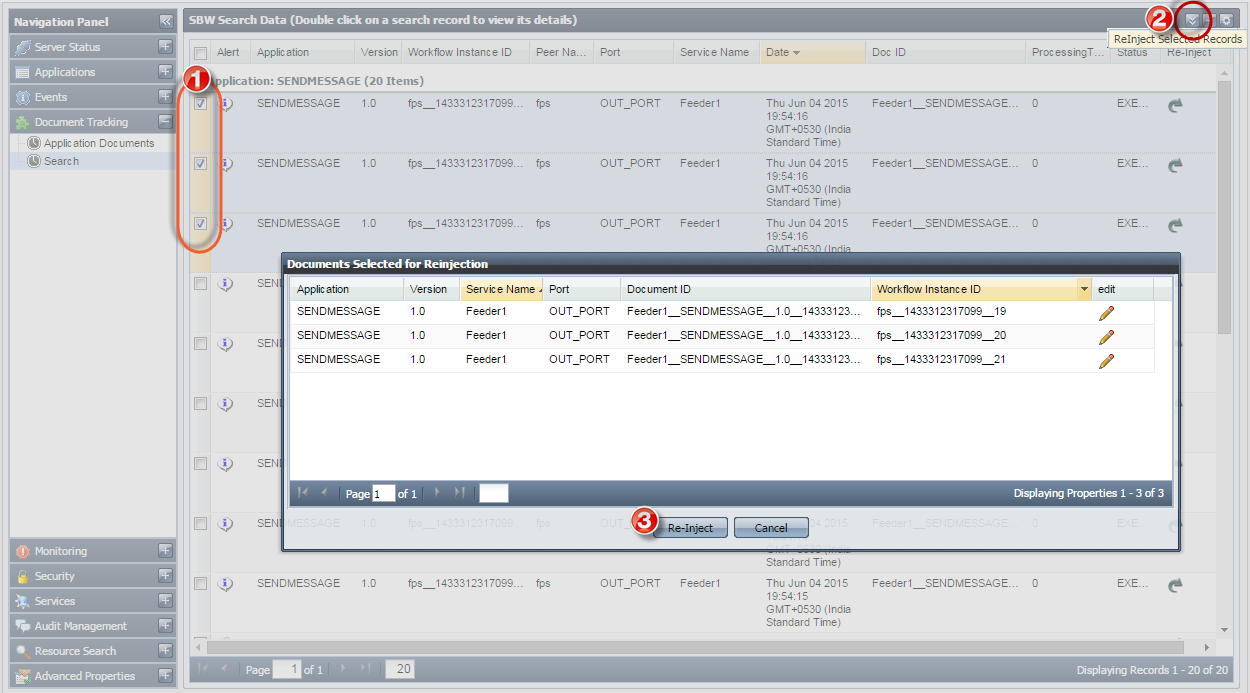
Figure 29: Selecting documents to reinject
Deleting Selected Documents
To delete a document or a selected set of documents, select the record(s) and click Delete Selected Documents button present in the upper-right part of the screen.

Figure 30: Selecting documents to delete SBW records
Scheduling Deletion of SBW Documents
...
The monitoring section helps you add policies or alerts to monitor the Fiorano Network.
| Tip |
|---|
Refer to Monitoring section for detailed description on Backlog Monitoring feature |
The Monitoring tab has the following sections:
- Monitor Messages
- Policy Manager
- Alert Manager
| Note |
|---|
Refer to section Monitoring for detailed description on Backlog Monitoring feature. |
Monitor Messages
This tab allows to Monitor Pending Messages, Deliverable Messages, Undeleted Messages, Active Senders, and Receivers Count for the Queues of Applications in Running State. Queue Monitoring can be done in two views :
Data view
This view shows the Queue Information in data form.
To display data in Data view and monitor the Queues, click Filter Queues button at upper-right part of the screen; Monitoring Filter window appears.

Figure 29: Monitoring data Filters
Select PeerName, Application, Version and click Search Button; queues of the selected Applications will be displayed.

Figure 30: Enable Monitoring
The Queue Information will be displayed on clicking the Enable Monitoring button and to stop monitoring a particular queue, click the Stop Monitoring button.

Figure 31: Data View
Graph View
Queue Monitoring information is displayed in Graphical form. The Graph keeps on updating for every 5 seconds.
| Note |
|---|
Note that only one queue can be monitored at a single time in Graph View. |

Figure 32: Graph View
Monitor Messages
| Tip |
|---|
Refer the Monitoring Messages section to see how to monitor messages. |
Policy Manager
This tab shows all the policies that are present in the Fiorano Network. This tab allows you to add new policies, edit or delete an existing policy, apply or suspend existing policies.
...
- Backlog Policy
- LowMemory Policy
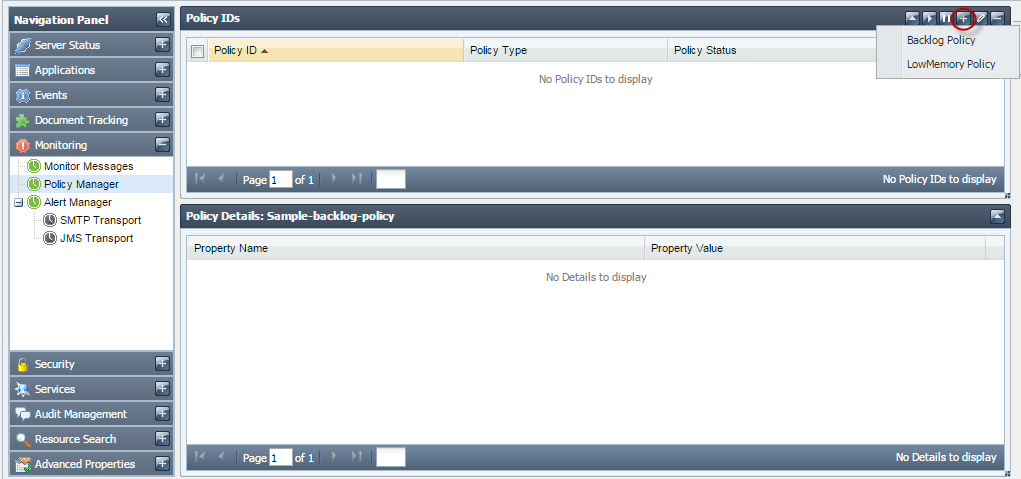
Figure 3331: Policy Manager
Alert Manager
...
- SMTP Alert
- JMS Alert
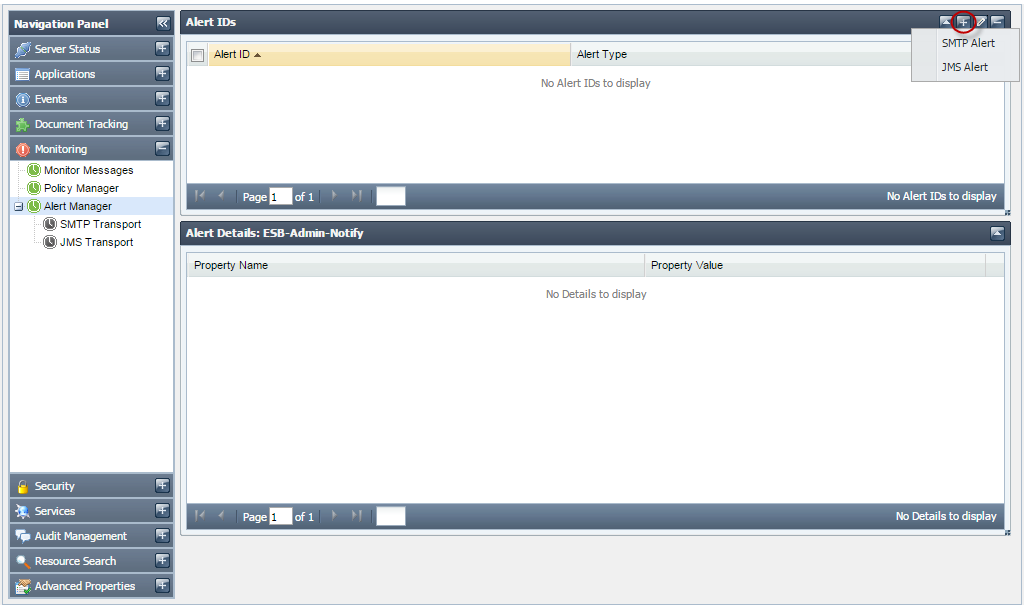
Figure 3432: Alert Manager
This tab has two sub-tabs. These allow to specify the transport settings that will be used for sending the alerts. The settings can be specified for SMTP and JMS transports.

Figure 3533: SMTP Transport

Figure 3634: JMS Transport
Security
Security section gives the security actions that can be performed in the Fiorano Network. These include adding/ editing users, groups, application level or group level permissions and validation or strength rules for passwords. These also include the principal store synchronization.
...
This tab shows you details of Users currently registered in the Fiorano network. The actions that can be undertaken in this tab include creating new users, deleting an existing user or changing password for an existing user, provided that you have the proper User Permissions to do so.
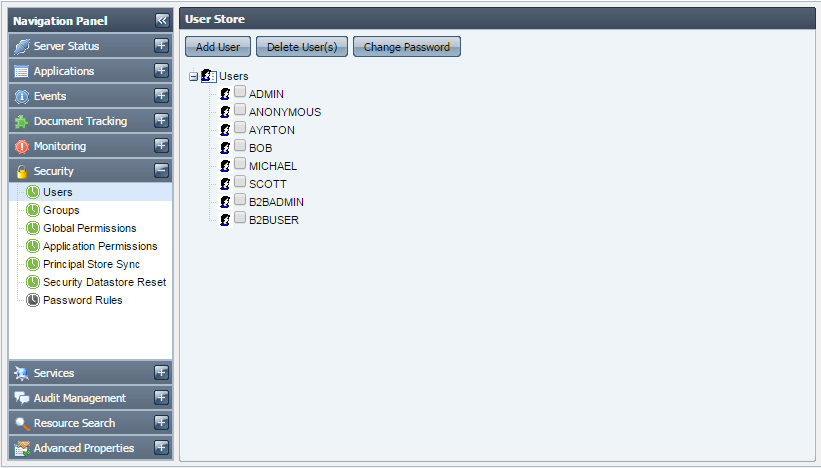
Figure 3735: Users
Groups
This tab shows the groups registered in the Fiorano network. Groups allow grouping users together and applying actions on them together. The actions that can be undertaken in this tab include creating new groups, deleting/editing an existing group, provided that you have proper User Permissions to do so.
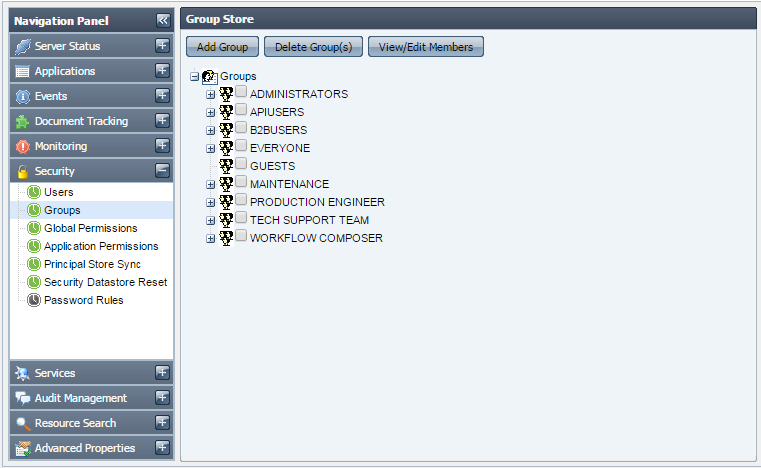
Figure 3836: Groups
Global Permissions
This tab shows the global permissions that are currently available in the Fiorano network. This tab allows you to edit or specify the users for whom these permissions will be applicable, provided that you have proper User Permissions to do so.
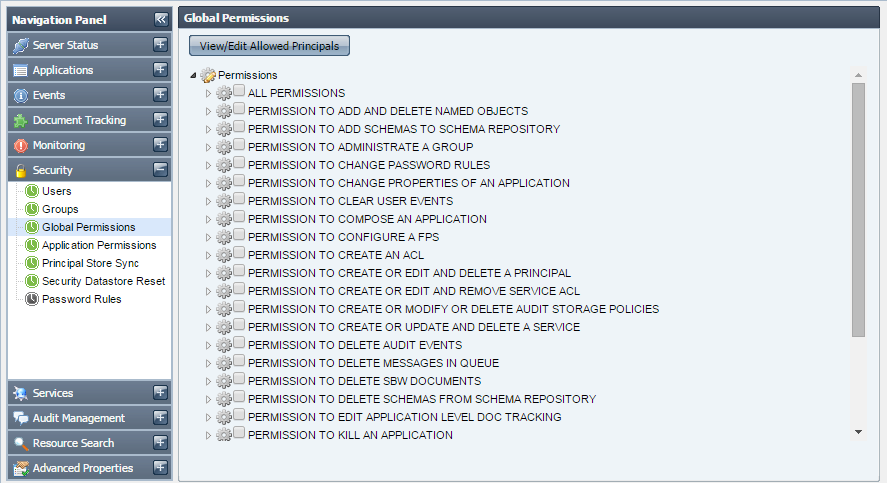
Figure 3937: Global Permissions
Application Permissions
...
| Info |
|---|
Application level permissions override global level permissions. For example, if a user is given launch permission for applications in global permissions, but for a particular application, he/she is not granted the permission to launch that application, then the user will not be allowed to launch that particular application. |
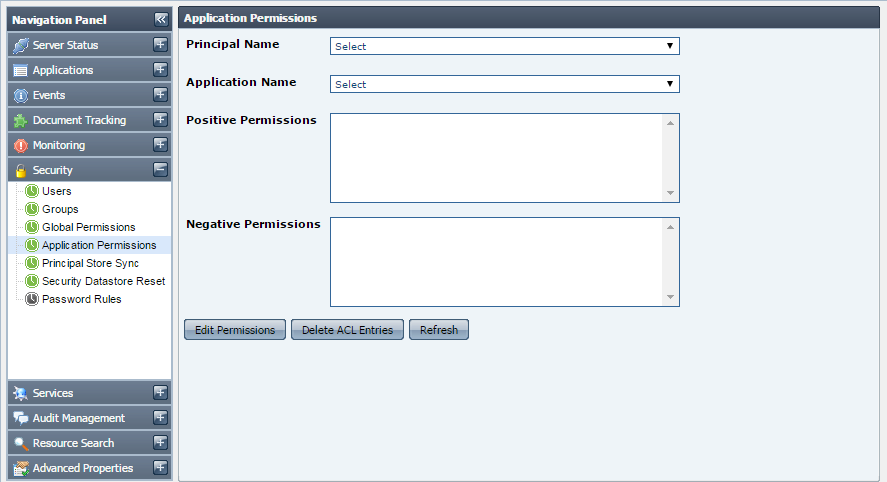
Figure 4038: Application Permissions
...
This tab shows the principal store synchronization status for the connected peers. This also allows you to synchronize the store for a peer.
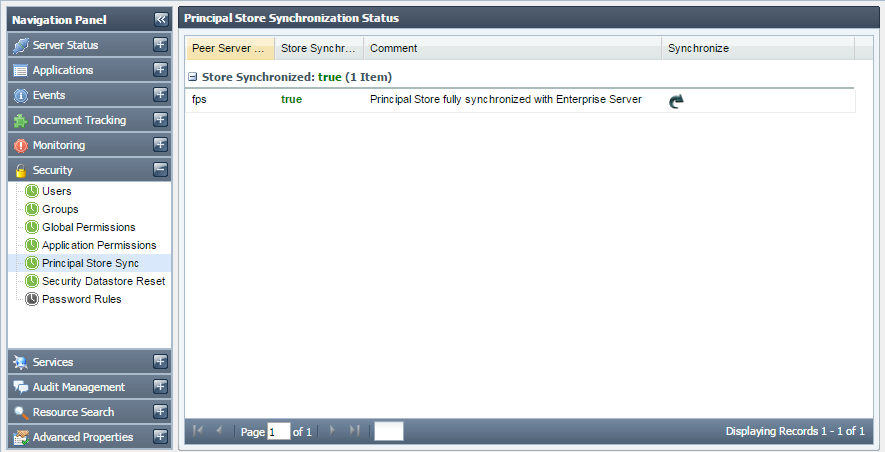
Figure 4139: Principal Store Sync
Security Datastore Reset
This tab shows the Security Datastore of the Enterprise Network. It also allows the authorized user to reset the entire Security Datastore viz. the Principals and the ACLs to system default.
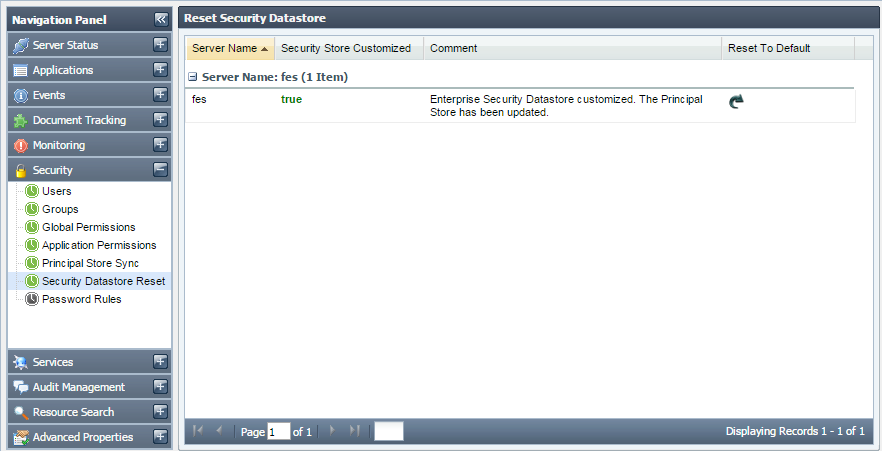
Figure 4240: Security Datastore Reset
...
This tab shows the validation and strength rules that are used for matching the passwords or determining their strengths. This tab allows you to add new rules or remove an existing one. By default, no validation rules are provided.
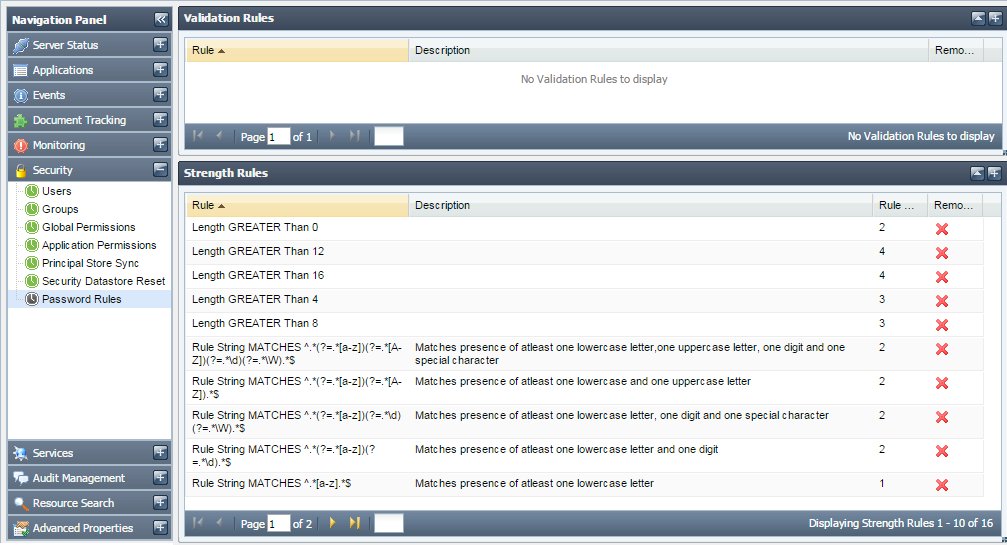
Figure 4341: Password Rules
Services
The Services tab shows the details of the event processes deployed as Web Services. You can view the status of web service either online or offline and has the option of enabling or disabling this option. You can also test RESTful deployed from the dashboard.
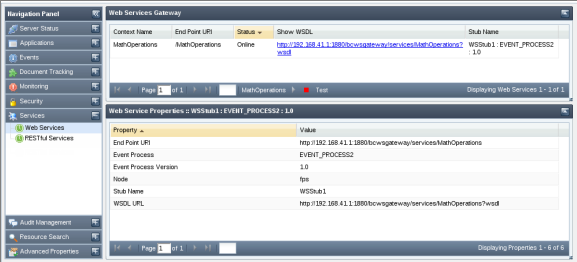
Figure 4442: Web Services - Event process
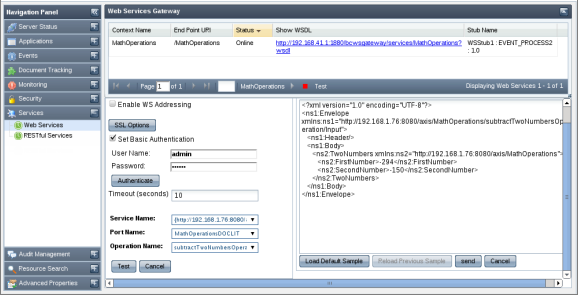
Figure 4543: Web Services tab
The details shown for the Event Process deployed as web services are:
...
In this view, you can view/edit available audit policies. These policies define the actions that will be audited by the system. In a fresh installation, all policies are in passive state, meaning none of the action is audited. You can selectively enable the actions that they want to audit.
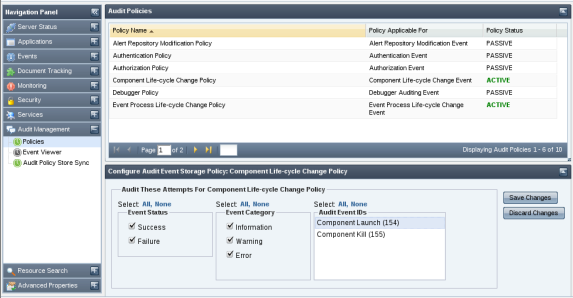
Figure 4644: Policies
Event Viewer
This view shows audit events based on the search criteria's specified by you. A comprehensive list of audit event filters is available to refine the audit events as per your requirement. This view also allows saving search preferences for later use, thus avoiding the painful task of creating audit filters each time you need to search. Below is a snapshot of Event Viewer page rendered after searching for certain audit events.
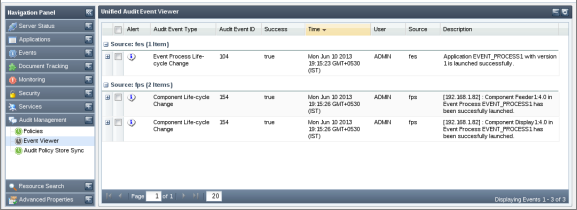
Figure 4745: Event Viewer
Audit Policy Store Synchronization
This view shows the result of synchronization of audit policy store operation (See image below). A synchronized audit policy store means that the same audit policies (as in Enterprise Server) are active in peer servers as well. If stores are not synchronized, the status field will display 'false' and the reason for which the synchronization not achieved will be displayed under Comment column. You can force re-synchronization of audit policies with a particular peer server by clicking on the image shown under 'Synchronize' column.
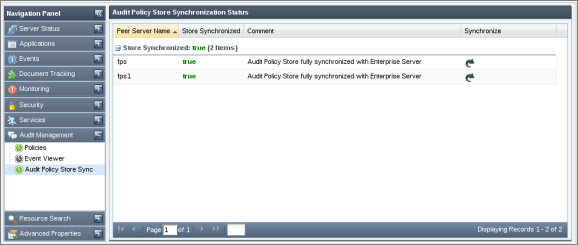
Figure 4846: Audit Policy Store Synchronization
...
- Application View
- Component View
- Resource View
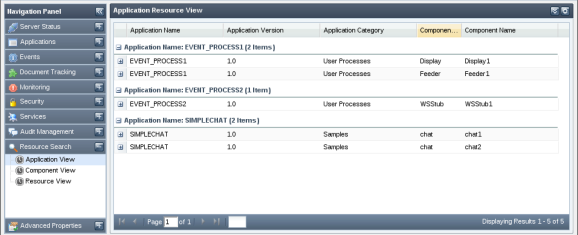
Figure 4947: Searching configured resources based on application view
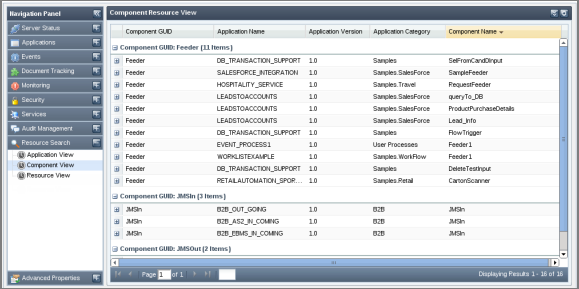
Figure 5048: Searching configured resources based on component view
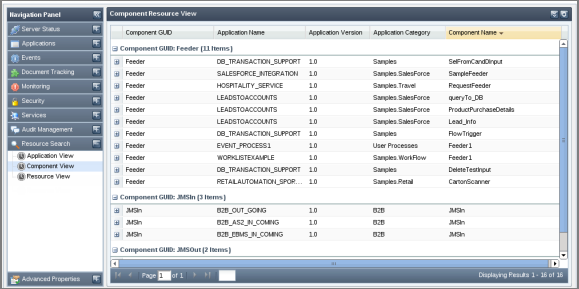
Figure 5149: Searching configured resources based on resource view
...
This tab allows you to change values of frequently used server properties from Dashboard.
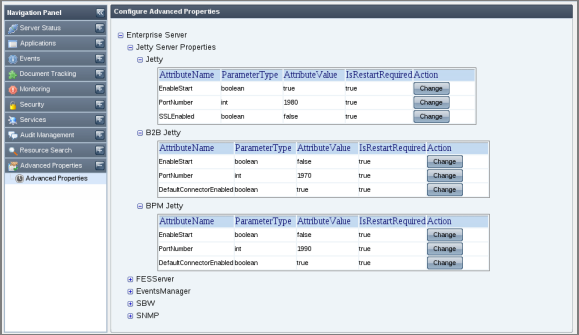
Figure 5250: Advanced Properties
Click the Change button of the attribute whose value has to be changed; Change value dialog box appears. Click OK after changing the value.
| Note |
|---|
If the restart required is true for the attribute. Then server needs to be restarted to get that value into effect. |
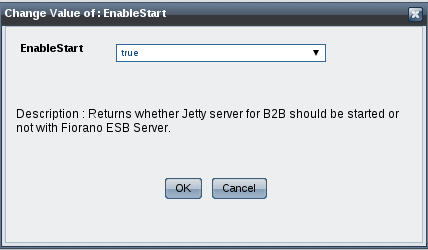
Figure 5351: Change Attribute Value
Enabling Fiorano Web Console
...
| Tip |
|---|
While starting peer server, the port for WMT will be listed as the Dashboard Listening Port. |