...
You can view the CPU utilization and memory usage statistics for the selected servers via graphs. You can select the time interval after which the plots have to be updated from the given set of time intervals.

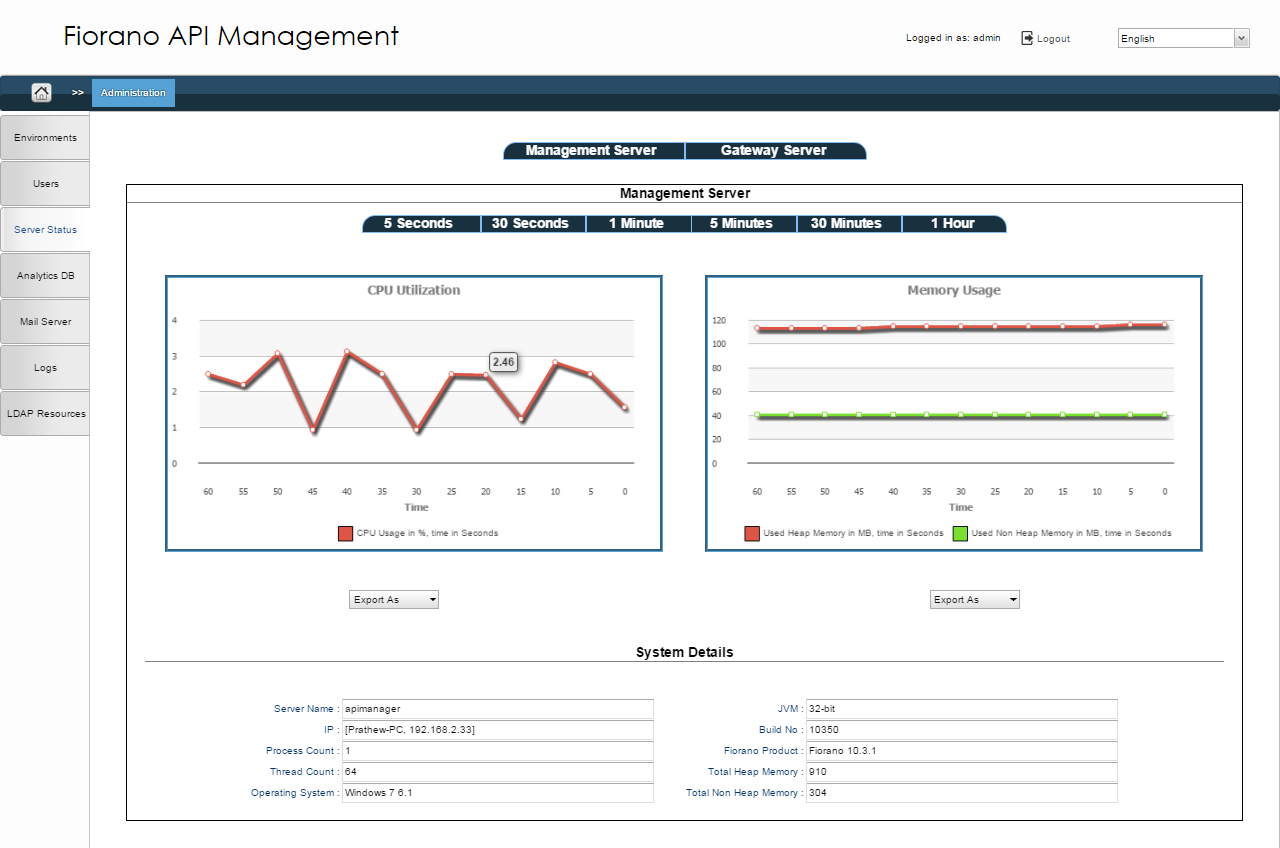
Figure 1: Server Status page in the Administration section section
...
Sample CPU Utilization Graph

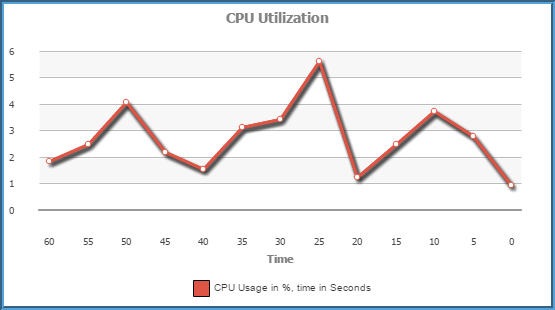
Figure 2: CPU Utilization graph with percentage of utilzation against Time in minutes
Sample Memory Usage Graph

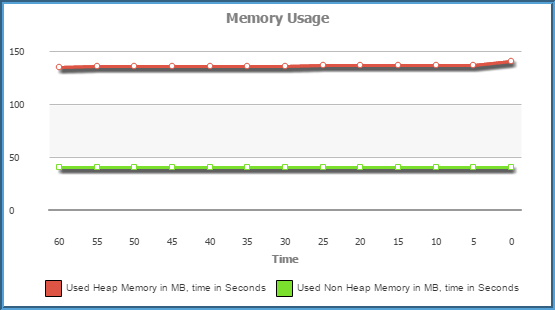
Figure 3: Memory Usage graph with Heap Memory in MB against Time in minutes
In addition, system details are displayed at the bottom of the panel.

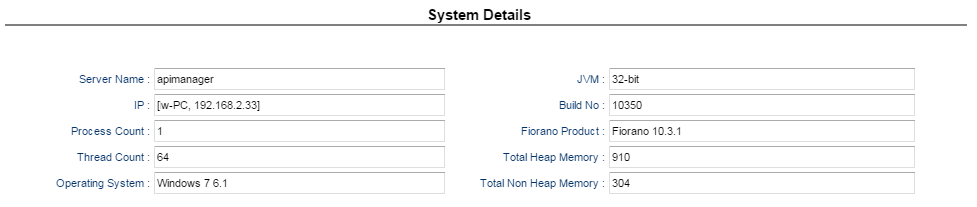
Figure 3: System details in figures
...
You do not need to remember the data as you have an option to export it . You can export the above graphs in PNG, JPEG or PDF formats using the Export as button present below the graphs.

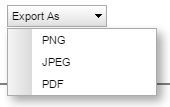
Figure 4: Export as option with the list of formats available for uploading
...