...
This section shows the details of the event processes running on the Fiorano Peer Server, helps importing applications and also to monitor performance.
Applications
The top view shows the list of event processes saved in the Fiorano Server. It also shows the details like running status, category and the Peer servers used. By clicking on the link for each event process, you get the details of the Service Instances running as part of it. This page also provides capabilities to launch, stop, restart an event process or its components, View Output and Error logs, and Export logs (These features is are disabled if the event process is in debug Debug mode). The details for the services are displayed in the bottom view. This includes:
- Service Instance Name - Service components in the event process
- Service GUID - Service GUID of the component
- Version - Version of the component
- Status - Displays whether the component is running or not
- Running on Peer - Name of the peer server on which the component is launched
- Launch Type - Displays whether the component is launched as a separate process, in-memory or manual.
- Memory Usage - Displays memory usage for CCP enabled components
- Process ID - Displays process id for CCP enabled components which are executed as a separate process
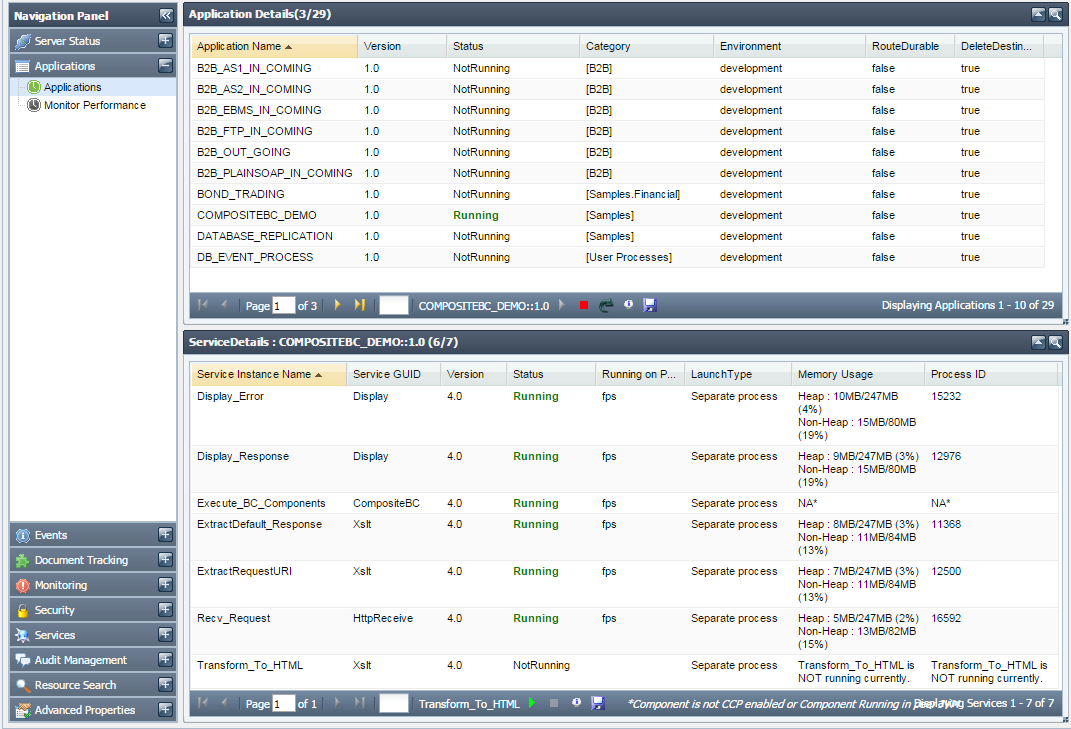
Figure 10: Applications Tab showing the details of the applications
Import Application
Import Application helps to import event processes which are exported or saved in a particular location.

To import an event process or multiple event processes saved in a file, provide the following details, select the Zip file by clicking the Choose File button and click Submit.
| Property | Description | ||||||||||||
| Overwrite existing EP |
| ||||||||||||
| Overwrite existing Named Config |
| ||||||||||||
| Overwrite existing Referred EPs List |
| ||||||||||||
| Import whole EP with Dependencies |
| ||||||||||||
| Ignore Dependencies |
| ||||||||||||
| Exempted List | Names of the named configurations to be exempted while importing. Exempted named configs should be mentioned as a comma-separated list of the following format:
| ||||||||||||
| EP names to be ignored | In a ZIP file with multiple EPs, specify the comma-separated names of the EPs that need not be imported along with the other EPs in the file.
| ||||||||||||
| Default application Version (used when not set in zip) | Specify a version number if a version number was not set in the zip file. | ||||||||||||
| Label | Provide the environment name.
|
Monitor Performance
You can monitor the performance of services by enabling monitoring in the respective component CPS. Performance statistics is shown in two views - Data View and Graph View.
| Note |
|---|
To monitor user Events, you need to enable a parameter - ListenForUserEvents in FES profile. This can be done from eStudio Profile Manager or from the Dashboard. Refer the Enable ListenForUserEvents parameter for Monitoring Performance section to read through the steps. |
Data View
This view shows performance messages sent by components in data form. You have the choice to select the components for which monitoring data should be displayed. Also, the time-interval for which monitoring data is displayed can be configured.
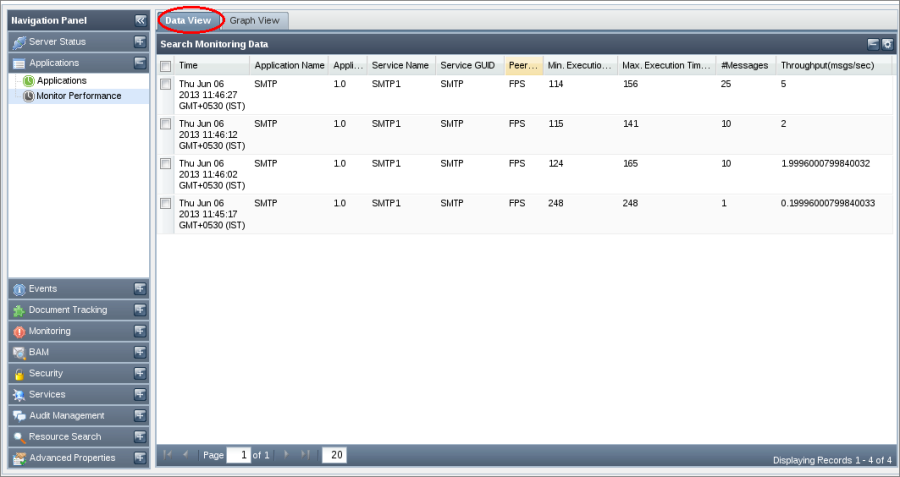
Figure 11: Data View tab
Graph View
Performance of a component is represented in a graphical form. Graphs can be monitored for archived performance data or for the latest data. To show latest performance data, select Live Graph option. Maximum number of points plotted on the graph can be configured by specifying desired value for the Max Points field. It is recommended to use Firefox 2.0 or Internet Explorer to see Graph View.
...